Croatian vs Immigrants from Canada Median Household Income
COMPARE
Croatian
Immigrants from Canada
Median Household Income
Median Household Income Comparison
Croatians
Immigrants from Canada
$90,685
MEDIAN HOUSEHOLD INCOME
97.3/ 100
METRIC RATING
107th/ 347
METRIC RANK
$92,029
MEDIAN HOUSEHOLD INCOME
98.8/ 100
METRIC RATING
88th/ 347
METRIC RANK
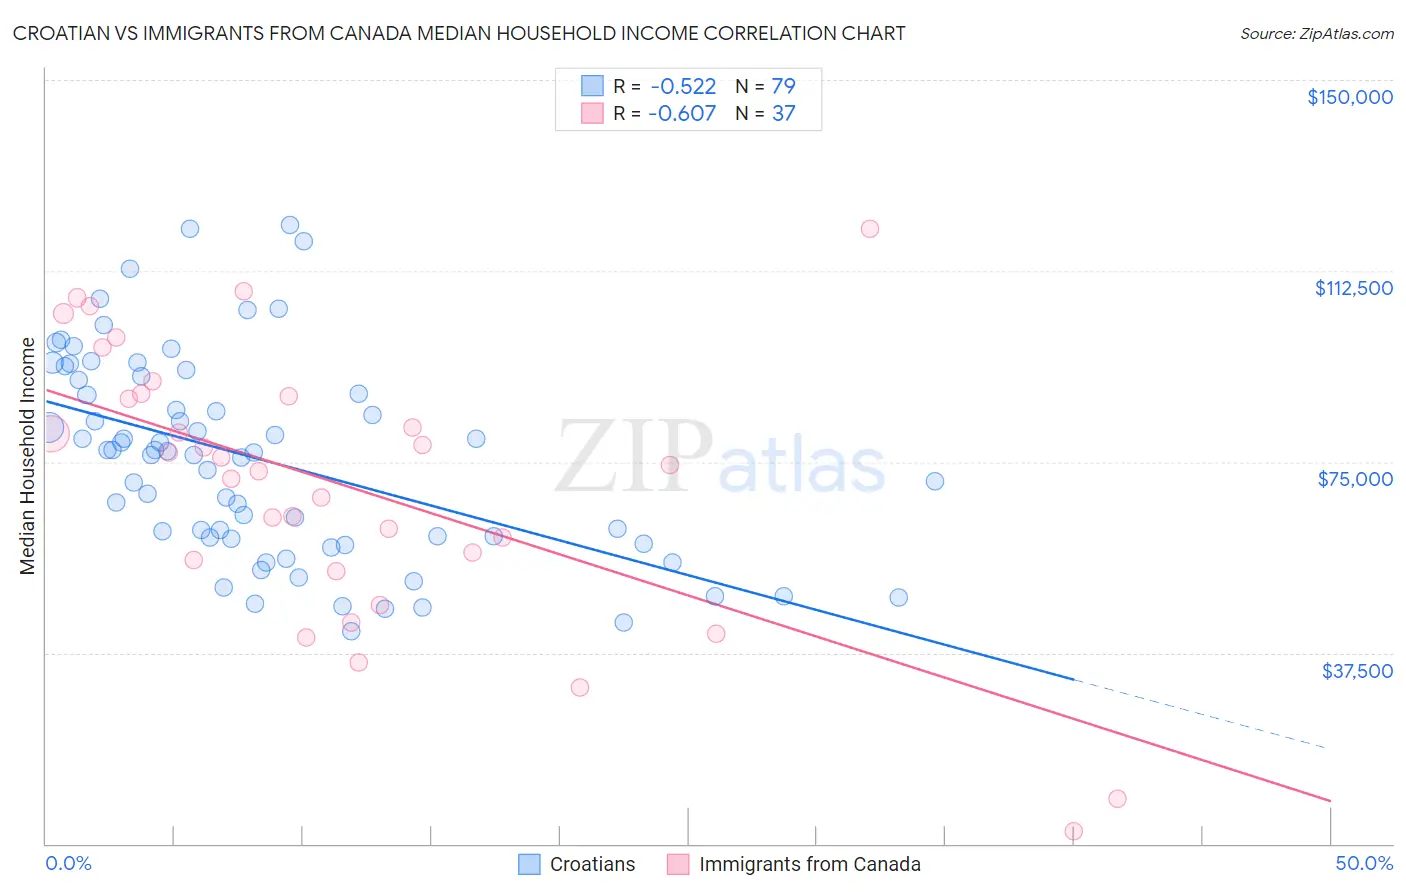
Croatian vs Immigrants from Canada Median Household Income Correlation Chart
The statistical analysis conducted on geographies consisting of 375,471,157 people shows a substantial negative correlation between the proportion of Croatians and median household income in the United States with a correlation coefficient (R) of -0.522 and weighted average of $90,685. Similarly, the statistical analysis conducted on geographies consisting of 459,019,816 people shows a significant negative correlation between the proportion of Immigrants from Canada and median household income in the United States with a correlation coefficient (R) of -0.607 and weighted average of $92,029, a difference of 1.5%.
Median Household Income Correlation Summary
| Measurement | Croatian | Immigrants from Canada |
| Minimum | $41,696 | $2,499 |
| Maximum | $121,425 | $120,804 |
| Range | $79,729 | $118,305 |
| Mean | $75,345 | $70,352 |
| Median | $76,836 | $74,400 |
| Interquartile 25% (IQ1) | $59,949 | $54,648 |
| Interquartile 75% (IQ3) | $91,012 | $88,077 |
| Interquartile Range (IQR) | $31,063 | $33,429 |
| Standard Deviation (Sample) | $19,789 | $27,047 |
| Standard Deviation (Population) | $19,663 | $26,679 |
Demographics Similar to Croatians and Immigrants from Canada by Median Household Income
In terms of median household income, the demographic groups most similar to Croatians are Macedonian ($90,761, a difference of 0.080%), Immigrants from Brazil ($90,907, a difference of 0.25%), Immigrants from Kazakhstan ($91,015, a difference of 0.36%), Immigrants from Ukraine ($91,124, a difference of 0.48%), and Austrian ($91,339, a difference of 0.72%). Similarly, the demographic groups most similar to Immigrants from Canada are Romanian ($91,994, a difference of 0.040%), Assyrian/Chaldean/Syriac ($91,991, a difference of 0.040%), Immigrants from Vietnam ($91,987, a difference of 0.050%), Immigrants from Hungary ($92,094, a difference of 0.070%), and Immigrants from Western Europe ($91,936, a difference of 0.10%).
| Demographics | Rating | Rank | Median Household Income |
| Immigrants | Hungary | 98.9 /100 | #87 | Exceptional $92,094 |
| Immigrants | Canada | 98.8 /100 | #88 | Exceptional $92,029 |
| Romanians | 98.8 /100 | #89 | Exceptional $91,994 |
| Assyrians/Chaldeans/Syriacs | 98.8 /100 | #90 | Exceptional $91,991 |
| Immigrants | Vietnam | 98.8 /100 | #91 | Exceptional $91,987 |
| Immigrants | Western Europe | 98.8 /100 | #92 | Exceptional $91,936 |
| Immigrants | Lebanon | 98.7 /100 | #93 | Exceptional $91,887 |
| Immigrants | North America | 98.7 /100 | #94 | Exceptional $91,860 |
| Armenians | 98.7 /100 | #95 | Exceptional $91,807 |
| Jordanians | 98.7 /100 | #96 | Exceptional $91,794 |
| Immigrants | Serbia | 98.6 /100 | #97 | Exceptional $91,730 |
| Immigrants | Southern Europe | 98.5 /100 | #98 | Exceptional $91,605 |
| Immigrants | South Eastern Asia | 98.4 /100 | #99 | Exceptional $91,541 |
| Ukrainians | 98.3 /100 | #100 | Exceptional $91,456 |
| Immigrants | Moldova | 98.3 /100 | #101 | Exceptional $91,446 |
| Austrians | 98.2 /100 | #102 | Exceptional $91,339 |
| Immigrants | Ukraine | 98.0 /100 | #103 | Exceptional $91,124 |
| Immigrants | Kazakhstan | 97.8 /100 | #104 | Exceptional $91,015 |
| Immigrants | Brazil | 97.7 /100 | #105 | Exceptional $90,907 |
| Macedonians | 97.4 /100 | #106 | Exceptional $90,761 |
| Croatians | 97.3 /100 | #107 | Exceptional $90,685 |