Immigrants from Jamaica vs Immigrants from Canada Median Household Income
COMPARE
Immigrants from Jamaica
Immigrants from Canada
Median Household Income
Median Household Income Comparison
Immigrants from Jamaica
Immigrants from Canada
$75,851
MEDIAN HOUSEHOLD INCOME
0.3/ 100
METRIC RATING
268th/ 347
METRIC RANK
$92,029
MEDIAN HOUSEHOLD INCOME
98.8/ 100
METRIC RATING
88th/ 347
METRIC RANK
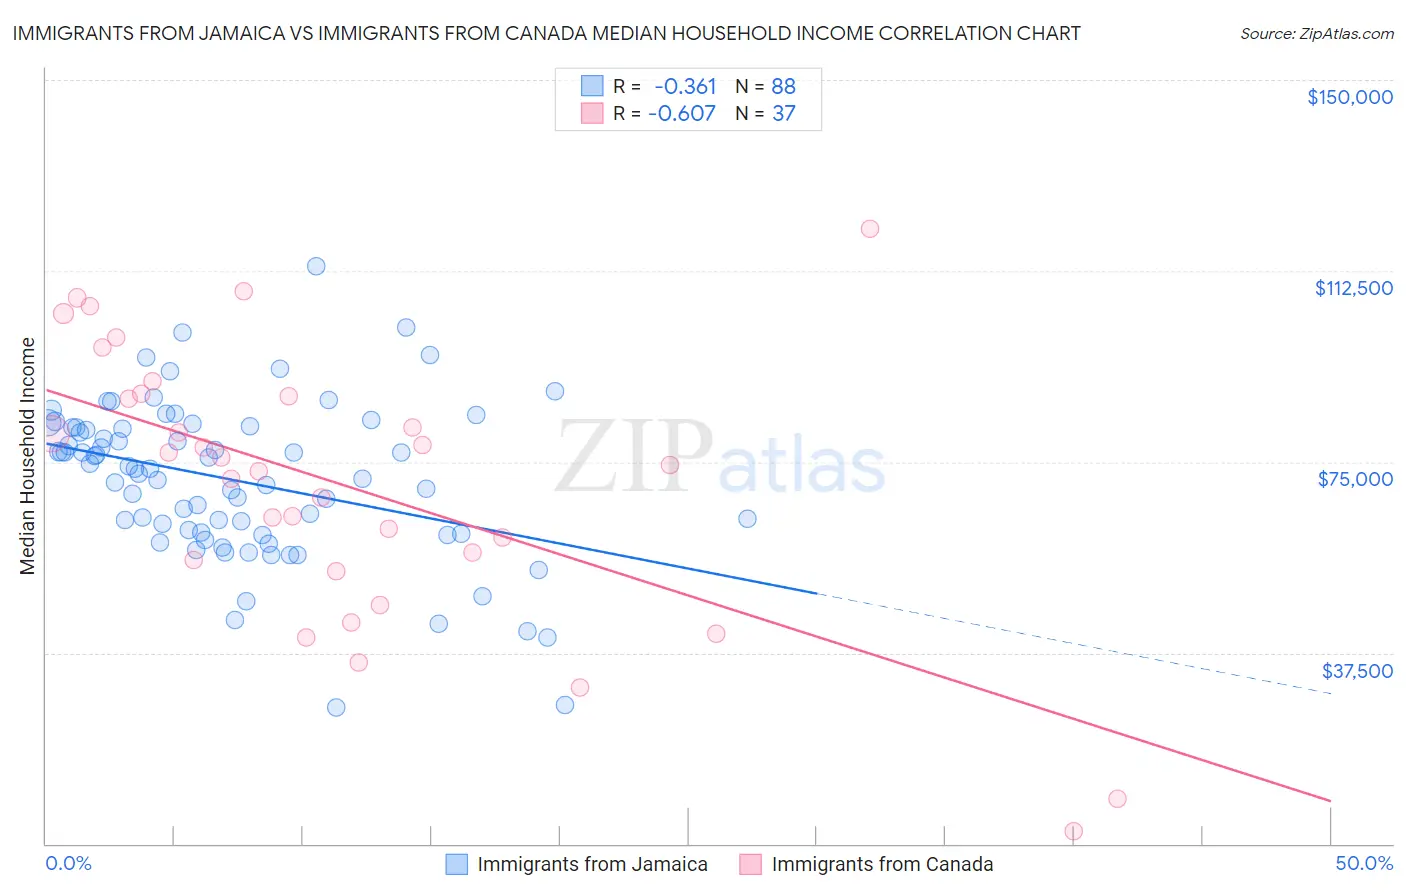
Immigrants from Jamaica vs Immigrants from Canada Median Household Income Correlation Chart
The statistical analysis conducted on geographies consisting of 301,517,769 people shows a mild negative correlation between the proportion of Immigrants from Jamaica and median household income in the United States with a correlation coefficient (R) of -0.361 and weighted average of $75,851. Similarly, the statistical analysis conducted on geographies consisting of 459,019,816 people shows a significant negative correlation between the proportion of Immigrants from Canada and median household income in the United States with a correlation coefficient (R) of -0.607 and weighted average of $92,029, a difference of 21.3%.
Median Household Income Correlation Summary
| Measurement | Immigrants from Jamaica | Immigrants from Canada |
| Minimum | $26,823 | $2,499 |
| Maximum | $113,462 | $120,804 |
| Range | $86,639 | $118,305 |
| Mean | $71,387 | $70,352 |
| Median | $73,716 | $74,400 |
| Interquartile 25% (IQ1) | $60,983 | $54,648 |
| Interquartile 75% (IQ3) | $81,782 | $88,077 |
| Interquartile Range (IQR) | $20,798 | $33,429 |
| Standard Deviation (Sample) | $15,538 | $27,047 |
| Standard Deviation (Population) | $15,449 | $26,679 |
Similar Demographics by Median Household Income
Demographics Similar to Immigrants from Jamaica by Median Household Income
In terms of median household income, the demographic groups most similar to Immigrants from Jamaica are Cape Verdean ($75,848, a difference of 0.0%), German Russian ($75,856, a difference of 0.010%), Hmong ($75,839, a difference of 0.020%), Pennsylvania German ($75,814, a difference of 0.050%), and Somali ($75,782, a difference of 0.090%).
| Demographics | Rating | Rank | Median Household Income |
| Immigrants | Grenada | 0.4 /100 | #261 | Tragic $76,517 |
| French American Indians | 0.4 /100 | #262 | Tragic $76,387 |
| Alaskan Athabascans | 0.4 /100 | #263 | Tragic $76,383 |
| Guatemalans | 0.3 /100 | #264 | Tragic $75,961 |
| Immigrants | Belize | 0.3 /100 | #265 | Tragic $75,938 |
| Americans | 0.3 /100 | #266 | Tragic $75,932 |
| German Russians | 0.3 /100 | #267 | Tragic $75,856 |
| Immigrants | Jamaica | 0.3 /100 | #268 | Tragic $75,851 |
| Cape Verdeans | 0.3 /100 | #269 | Tragic $75,848 |
| Hmong | 0.3 /100 | #270 | Tragic $75,839 |
| Pennsylvania Germans | 0.3 /100 | #271 | Tragic $75,814 |
| Somalis | 0.3 /100 | #272 | Tragic $75,782 |
| Liberians | 0.2 /100 | #273 | Tragic $75,667 |
| British West Indians | 0.2 /100 | #274 | Tragic $75,647 |
| Immigrants | Micronesia | 0.2 /100 | #275 | Tragic $75,574 |
Demographics Similar to Immigrants from Canada by Median Household Income
In terms of median household income, the demographic groups most similar to Immigrants from Canada are Romanian ($91,994, a difference of 0.040%), Assyrian/Chaldean/Syriac ($91,991, a difference of 0.040%), Immigrants from Vietnam ($91,987, a difference of 0.050%), Immigrants from Hungary ($92,094, a difference of 0.070%), and Immigrants from England ($92,098, a difference of 0.080%).
| Demographics | Rating | Rank | Median Household Income |
| Immigrants | Eastern Europe | 99.4 /100 | #81 | Exceptional $93,051 |
| Immigrants | Spain | 99.3 /100 | #82 | Exceptional $92,732 |
| Italians | 99.1 /100 | #83 | Exceptional $92,475 |
| Immigrants | Argentina | 99.1 /100 | #84 | Exceptional $92,417 |
| Immigrants | Croatia | 99.0 /100 | #85 | Exceptional $92,225 |
| Immigrants | England | 98.9 /100 | #86 | Exceptional $92,098 |
| Immigrants | Hungary | 98.9 /100 | #87 | Exceptional $92,094 |
| Immigrants | Canada | 98.8 /100 | #88 | Exceptional $92,029 |
| Romanians | 98.8 /100 | #89 | Exceptional $91,994 |
| Assyrians/Chaldeans/Syriacs | 98.8 /100 | #90 | Exceptional $91,991 |
| Immigrants | Vietnam | 98.8 /100 | #91 | Exceptional $91,987 |
| Immigrants | Western Europe | 98.8 /100 | #92 | Exceptional $91,936 |
| Immigrants | Lebanon | 98.7 /100 | #93 | Exceptional $91,887 |
| Immigrants | North America | 98.7 /100 | #94 | Exceptional $91,860 |
| Armenians | 98.7 /100 | #95 | Exceptional $91,807 |