Iranian vs Choctaw Median Household Income
COMPARE
Iranian
Choctaw
Median Household Income
Median Household Income Comparison
Iranians
Choctaw
$109,835
MEDIAN HOUSEHOLD INCOME
100.0/ 100
METRIC RATING
7th/ 347
METRIC RANK
$69,947
MEDIAN HOUSEHOLD INCOME
0.0/ 100
METRIC RATING
322nd/ 347
METRIC RANK
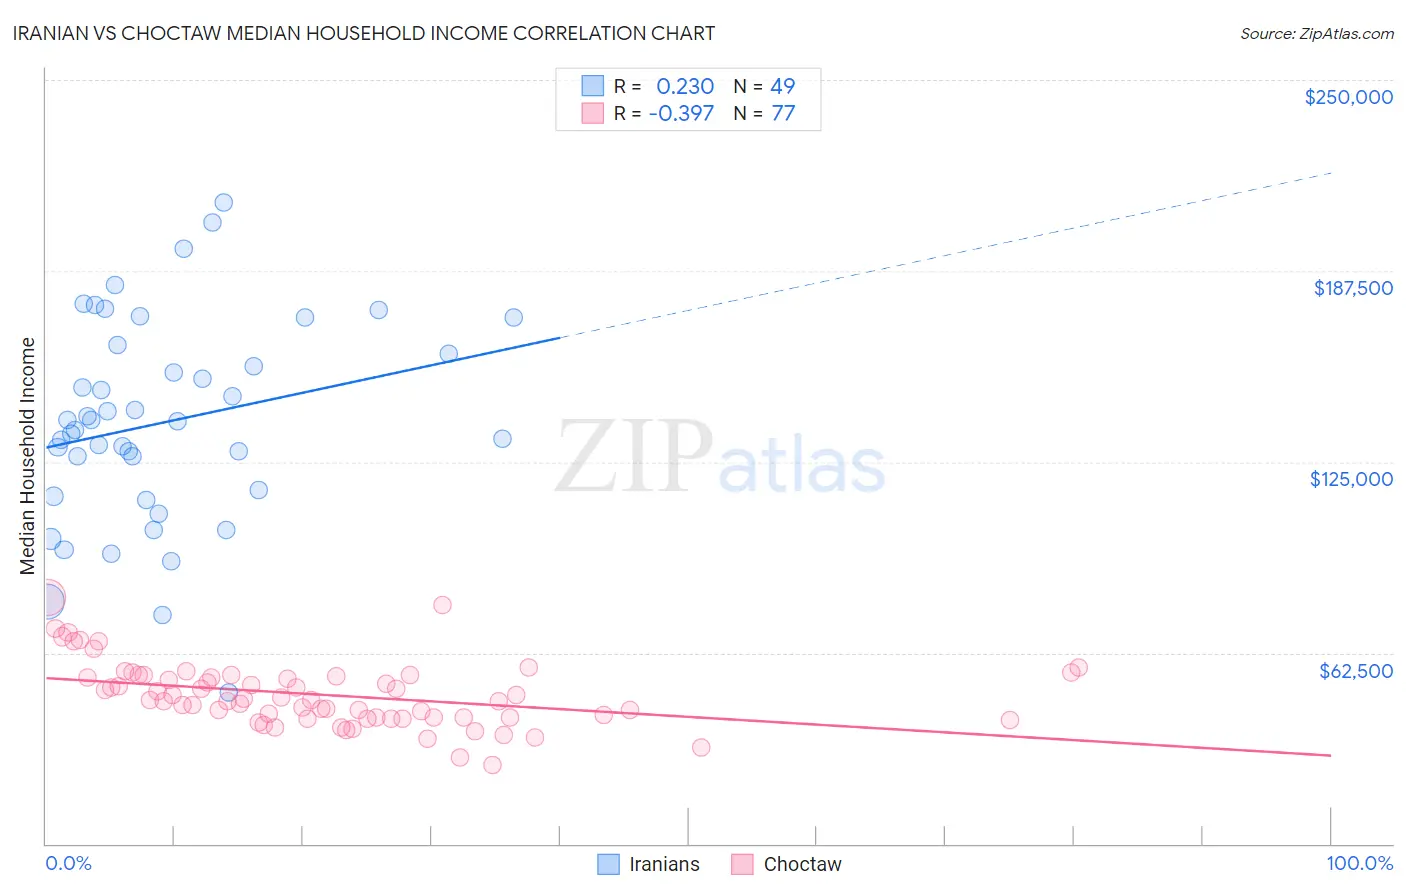
Iranian vs Choctaw Median Household Income Correlation Chart
The statistical analysis conducted on geographies consisting of 316,594,709 people shows a weak positive correlation between the proportion of Iranians and median household income in the United States with a correlation coefficient (R) of 0.230 and weighted average of $109,835. Similarly, the statistical analysis conducted on geographies consisting of 269,579,280 people shows a mild negative correlation between the proportion of Choctaw and median household income in the United States with a correlation coefficient (R) of -0.397 and weighted average of $69,947, a difference of 57.0%.
Median Household Income Correlation Summary
| Measurement | Iranian | Choctaw |
| Minimum | $49,583 | $25,625 |
| Maximum | $210,000 | $80,457 |
| Range | $160,417 | $54,832 |
| Mean | $137,928 | $48,786 |
| Median | $138,452 | $47,101 |
| Interquartile 25% (IQ1) | $114,688 | $41,215 |
| Interquartile 75% (IQ3) | $161,748 | $54,919 |
| Interquartile Range (IQR) | $47,060 | $13,705 |
| Standard Deviation (Sample) | $33,663 | $10,591 |
| Standard Deviation (Population) | $33,318 | $10,522 |
Similar Demographics by Median Household Income
Demographics Similar to Iranians by Median Household Income
In terms of median household income, the demographic groups most similar to Iranians are Immigrants from Singapore ($110,428, a difference of 0.54%), Thai ($110,648, a difference of 0.74%), Immigrants from Hong Kong ($111,519, a difference of 1.5%), Immigrants from Iran ($108,055, a difference of 1.7%), and Immigrants from India ($113,009, a difference of 2.9%).
| Demographics | Rating | Rank | Median Household Income |
| Immigrants | Taiwan | 100.0 /100 | #1 | Exceptional $116,460 |
| Filipinos | 100.0 /100 | #2 | Exceptional $115,509 |
| Immigrants | India | 100.0 /100 | #3 | Exceptional $113,009 |
| Immigrants | Hong Kong | 100.0 /100 | #4 | Exceptional $111,519 |
| Thais | 100.0 /100 | #5 | Exceptional $110,648 |
| Immigrants | Singapore | 100.0 /100 | #6 | Exceptional $110,428 |
| Iranians | 100.0 /100 | #7 | Exceptional $109,835 |
| Immigrants | Iran | 100.0 /100 | #8 | Exceptional $108,055 |
| Okinawans | 100.0 /100 | #9 | Exceptional $106,624 |
| Immigrants | South Central Asia | 100.0 /100 | #10 | Exceptional $106,057 |
| Immigrants | China | 100.0 /100 | #11 | Exceptional $105,335 |
| Indians (Asian) | 100.0 /100 | #12 | Exceptional $105,262 |
| Immigrants | Eastern Asia | 100.0 /100 | #13 | Exceptional $104,796 |
| Immigrants | Ireland | 100.0 /100 | #14 | Exceptional $104,692 |
| Immigrants | Israel | 100.0 /100 | #15 | Exceptional $104,090 |
Demographics Similar to Choctaw by Median Household Income
In terms of median household income, the demographic groups most similar to Choctaw are Chickasaw ($70,005, a difference of 0.080%), Colville ($70,094, a difference of 0.21%), Bahamian ($69,726, a difference of 0.32%), Yup'ik ($69,695, a difference of 0.36%), and Immigrants from Dominican Republic ($70,208, a difference of 0.37%).
| Demographics | Rating | Rank | Median Household Income |
| Ottawa | 0.0 /100 | #315 | Tragic $70,984 |
| Apache | 0.0 /100 | #316 | Tragic $70,927 |
| Cajuns | 0.0 /100 | #317 | Tragic $70,605 |
| Chippewa | 0.0 /100 | #318 | Tragic $70,539 |
| Immigrants | Dominican Republic | 0.0 /100 | #319 | Tragic $70,208 |
| Colville | 0.0 /100 | #320 | Tragic $70,094 |
| Chickasaw | 0.0 /100 | #321 | Tragic $70,005 |
| Choctaw | 0.0 /100 | #322 | Tragic $69,947 |
| Bahamians | 0.0 /100 | #323 | Tragic $69,726 |
| Yup'ik | 0.0 /100 | #324 | Tragic $69,695 |
| Seminole | 0.0 /100 | #325 | Tragic $69,420 |
| Yuman | 0.0 /100 | #326 | Tragic $68,743 |
| Immigrants | Cuba | 0.0 /100 | #327 | Tragic $68,461 |
| Menominee | 0.0 /100 | #328 | Tragic $68,423 |
| Dutch West Indians | 0.0 /100 | #329 | Tragic $68,412 |