Yuman vs Choctaw Median Household Income
COMPARE
Yuman
Choctaw
Median Household Income
Median Household Income Comparison
Yuman
Choctaw
$68,743
MEDIAN HOUSEHOLD INCOME
0.0/ 100
METRIC RATING
326th/ 347
METRIC RANK
$69,947
MEDIAN HOUSEHOLD INCOME
0.0/ 100
METRIC RATING
322nd/ 347
METRIC RANK
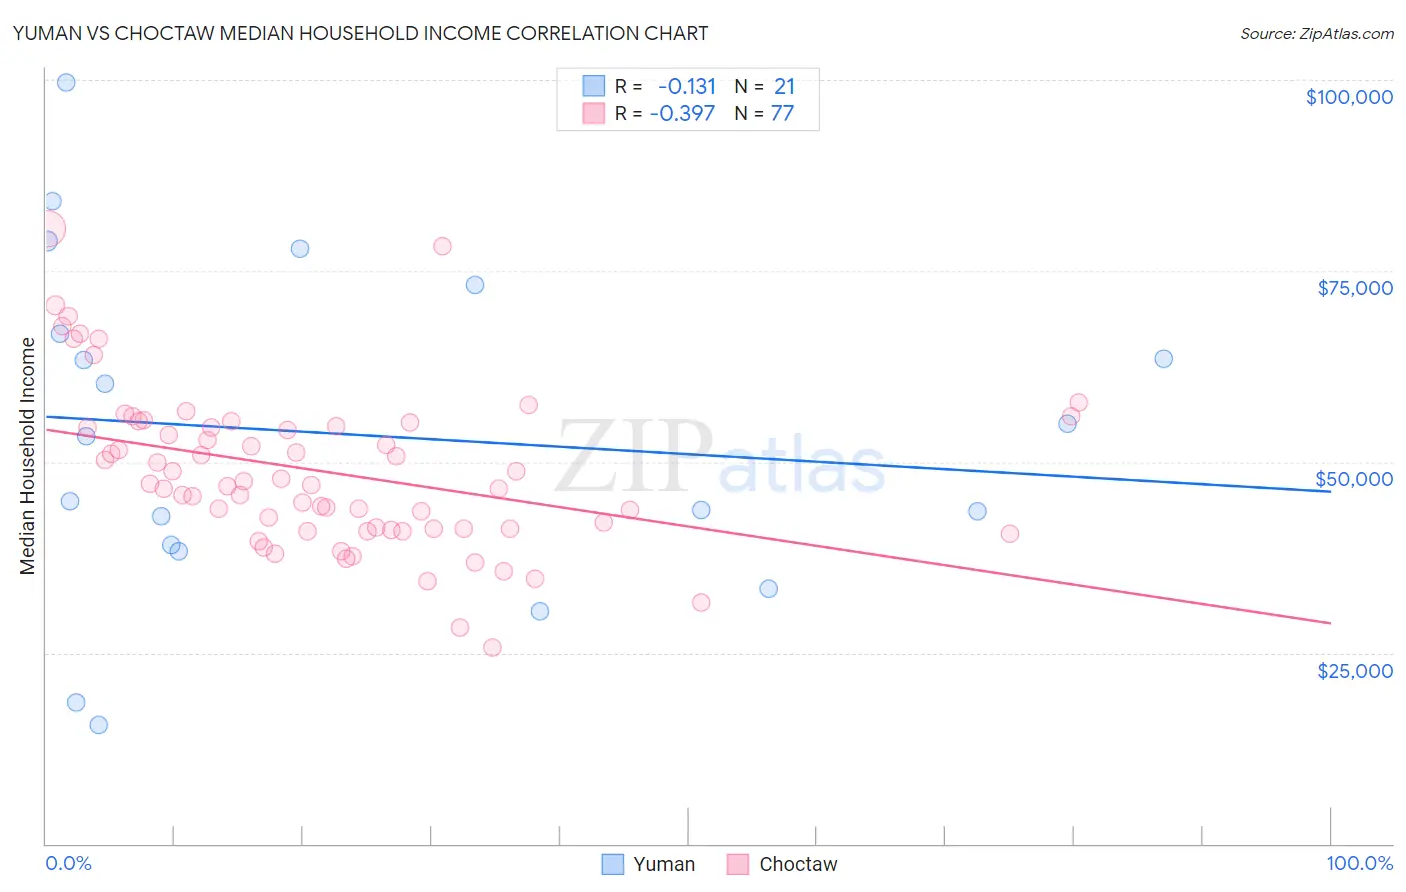
Yuman vs Choctaw Median Household Income Correlation Chart
The statistical analysis conducted on geographies consisting of 40,662,869 people shows a poor negative correlation between the proportion of Yuman and median household income in the United States with a correlation coefficient (R) of -0.131 and weighted average of $68,743. Similarly, the statistical analysis conducted on geographies consisting of 269,579,280 people shows a mild negative correlation between the proportion of Choctaw and median household income in the United States with a correlation coefficient (R) of -0.397 and weighted average of $69,947, a difference of 1.8%.
Median Household Income Correlation Summary
| Measurement | Yuman | Choctaw |
| Minimum | $15,625 | $25,625 |
| Maximum | $99,695 | $80,457 |
| Range | $84,070 | $54,832 |
| Mean | $53,635 | $48,786 |
| Median | $53,295 | $47,101 |
| Interquartile 25% (IQ1) | $38,762 | $41,215 |
| Interquartile 75% (IQ3) | $69,936 | $54,919 |
| Interquartile Range (IQR) | $31,174 | $13,705 |
| Standard Deviation (Sample) | $21,822 | $10,591 |
| Standard Deviation (Population) | $21,296 | $10,522 |
Demographics Similar to Yuman and Choctaw by Median Household Income
In terms of median household income, the demographic groups most similar to Yuman are Immigrants from Cuba ($68,461, a difference of 0.41%), Menominee ($68,423, a difference of 0.47%), Dutch West Indian ($68,412, a difference of 0.48%), Seminole ($69,420, a difference of 0.98%), and Arapaho ($67,965, a difference of 1.1%). Similarly, the demographic groups most similar to Choctaw are Chickasaw ($70,005, a difference of 0.080%), Colville ($70,094, a difference of 0.21%), Bahamian ($69,726, a difference of 0.32%), Yup'ik ($69,695, a difference of 0.36%), and Immigrants from Dominican Republic ($70,208, a difference of 0.37%).
| Demographics | Rating | Rank | Median Household Income |
| Dominicans | 0.0 /100 | #314 | Tragic $71,302 |
| Ottawa | 0.0 /100 | #315 | Tragic $70,984 |
| Apache | 0.0 /100 | #316 | Tragic $70,927 |
| Cajuns | 0.0 /100 | #317 | Tragic $70,605 |
| Chippewa | 0.0 /100 | #318 | Tragic $70,539 |
| Immigrants | Dominican Republic | 0.0 /100 | #319 | Tragic $70,208 |
| Colville | 0.0 /100 | #320 | Tragic $70,094 |
| Chickasaw | 0.0 /100 | #321 | Tragic $70,005 |
| Choctaw | 0.0 /100 | #322 | Tragic $69,947 |
| Bahamians | 0.0 /100 | #323 | Tragic $69,726 |
| Yup'ik | 0.0 /100 | #324 | Tragic $69,695 |
| Seminole | 0.0 /100 | #325 | Tragic $69,420 |
| Yuman | 0.0 /100 | #326 | Tragic $68,743 |
| Immigrants | Cuba | 0.0 /100 | #327 | Tragic $68,461 |
| Menominee | 0.0 /100 | #328 | Tragic $68,423 |
| Dutch West Indians | 0.0 /100 | #329 | Tragic $68,412 |
| Arapaho | 0.0 /100 | #330 | Tragic $67,965 |
| Natives/Alaskans | 0.0 /100 | #331 | Tragic $67,879 |
| Sioux | 0.0 /100 | #332 | Tragic $67,792 |
| Creek | 0.0 /100 | #333 | Tragic $67,715 |
| Blacks/African Americans | 0.0 /100 | #334 | Tragic $67,573 |