Afghan vs Choctaw Median Household Income
COMPARE
Afghan
Choctaw
Median Household Income
Median Household Income Comparison
Afghans
Choctaw
$97,026
MEDIAN HOUSEHOLD INCOME
100.0/ 100
METRIC RATING
39th/ 347
METRIC RANK
$69,947
MEDIAN HOUSEHOLD INCOME
0.0/ 100
METRIC RATING
322nd/ 347
METRIC RANK
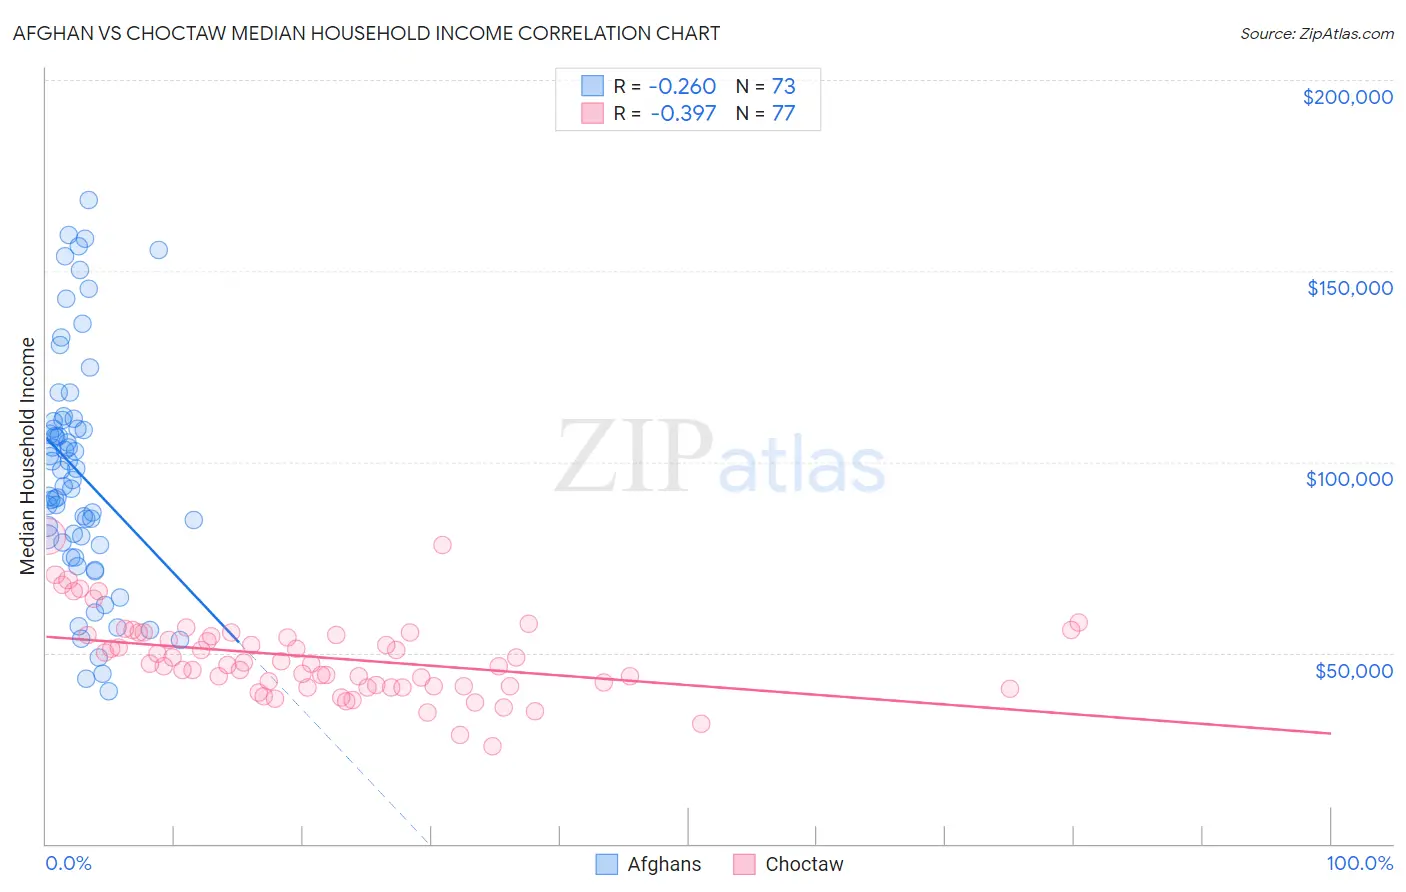
Afghan vs Choctaw Median Household Income Correlation Chart
The statistical analysis conducted on geographies consisting of 148,820,759 people shows a weak negative correlation between the proportion of Afghans and median household income in the United States with a correlation coefficient (R) of -0.260 and weighted average of $97,026. Similarly, the statistical analysis conducted on geographies consisting of 269,579,280 people shows a mild negative correlation between the proportion of Choctaw and median household income in the United States with a correlation coefficient (R) of -0.397 and weighted average of $69,947, a difference of 38.7%.
Median Household Income Correlation Summary
| Measurement | Afghan | Choctaw |
| Minimum | $40,069 | $25,625 |
| Maximum | $168,646 | $80,457 |
| Range | $128,577 | $54,832 |
| Mean | $97,284 | $48,786 |
| Median | $95,399 | $47,101 |
| Interquartile 25% (IQ1) | $78,550 | $41,215 |
| Interquartile 75% (IQ3) | $110,861 | $54,919 |
| Interquartile Range (IQR) | $32,311 | $13,705 |
| Standard Deviation (Sample) | $30,429 | $10,591 |
| Standard Deviation (Population) | $30,220 | $10,522 |
Similar Demographics by Median Household Income
Demographics Similar to Afghans by Median Household Income
In terms of median household income, the demographic groups most similar to Afghans are Maltese ($97,015, a difference of 0.010%), Immigrants from Turkey ($96,964, a difference of 0.060%), Immigrants from Lithuania ($96,836, a difference of 0.20%), Immigrants from Indonesia ($97,297, a difference of 0.28%), and Latvian ($97,311, a difference of 0.29%).
| Demographics | Rating | Rank | Median Household Income |
| Immigrants | Denmark | 100.0 /100 | #32 | Exceptional $98,510 |
| Chinese | 100.0 /100 | #33 | Exceptional $98,496 |
| Russians | 100.0 /100 | #34 | Exceptional $98,008 |
| Immigrants | Switzerland | 100.0 /100 | #35 | Exceptional $97,979 |
| Immigrants | Pakistan | 100.0 /100 | #36 | Exceptional $97,528 |
| Latvians | 100.0 /100 | #37 | Exceptional $97,311 |
| Immigrants | Indonesia | 100.0 /100 | #38 | Exceptional $97,297 |
| Afghans | 100.0 /100 | #39 | Exceptional $97,026 |
| Maltese | 100.0 /100 | #40 | Exceptional $97,015 |
| Immigrants | Turkey | 100.0 /100 | #41 | Exceptional $96,964 |
| Immigrants | Lithuania | 99.9 /100 | #42 | Exceptional $96,836 |
| Immigrants | France | 99.9 /100 | #43 | Exceptional $96,743 |
| Immigrants | Greece | 99.9 /100 | #44 | Exceptional $96,675 |
| Israelis | 99.9 /100 | #45 | Exceptional $96,552 |
| Australians | 99.9 /100 | #46 | Exceptional $96,490 |
Demographics Similar to Choctaw by Median Household Income
In terms of median household income, the demographic groups most similar to Choctaw are Chickasaw ($70,005, a difference of 0.080%), Colville ($70,094, a difference of 0.21%), Bahamian ($69,726, a difference of 0.32%), Yup'ik ($69,695, a difference of 0.36%), and Immigrants from Dominican Republic ($70,208, a difference of 0.37%).
| Demographics | Rating | Rank | Median Household Income |
| Ottawa | 0.0 /100 | #315 | Tragic $70,984 |
| Apache | 0.0 /100 | #316 | Tragic $70,927 |
| Cajuns | 0.0 /100 | #317 | Tragic $70,605 |
| Chippewa | 0.0 /100 | #318 | Tragic $70,539 |
| Immigrants | Dominican Republic | 0.0 /100 | #319 | Tragic $70,208 |
| Colville | 0.0 /100 | #320 | Tragic $70,094 |
| Chickasaw | 0.0 /100 | #321 | Tragic $70,005 |
| Choctaw | 0.0 /100 | #322 | Tragic $69,947 |
| Bahamians | 0.0 /100 | #323 | Tragic $69,726 |
| Yup'ik | 0.0 /100 | #324 | Tragic $69,695 |
| Seminole | 0.0 /100 | #325 | Tragic $69,420 |
| Yuman | 0.0 /100 | #326 | Tragic $68,743 |
| Immigrants | Cuba | 0.0 /100 | #327 | Tragic $68,461 |
| Menominee | 0.0 /100 | #328 | Tragic $68,423 |
| Dutch West Indians | 0.0 /100 | #329 | Tragic $68,412 |