Ute vs Choctaw Median Household Income
COMPARE
Ute
Choctaw
Median Household Income
Median Household Income Comparison
Ute
Choctaw
$72,402
MEDIAN HOUSEHOLD INCOME
0.0/ 100
METRIC RATING
307th/ 347
METRIC RANK
$69,947
MEDIAN HOUSEHOLD INCOME
0.0/ 100
METRIC RATING
322nd/ 347
METRIC RANK
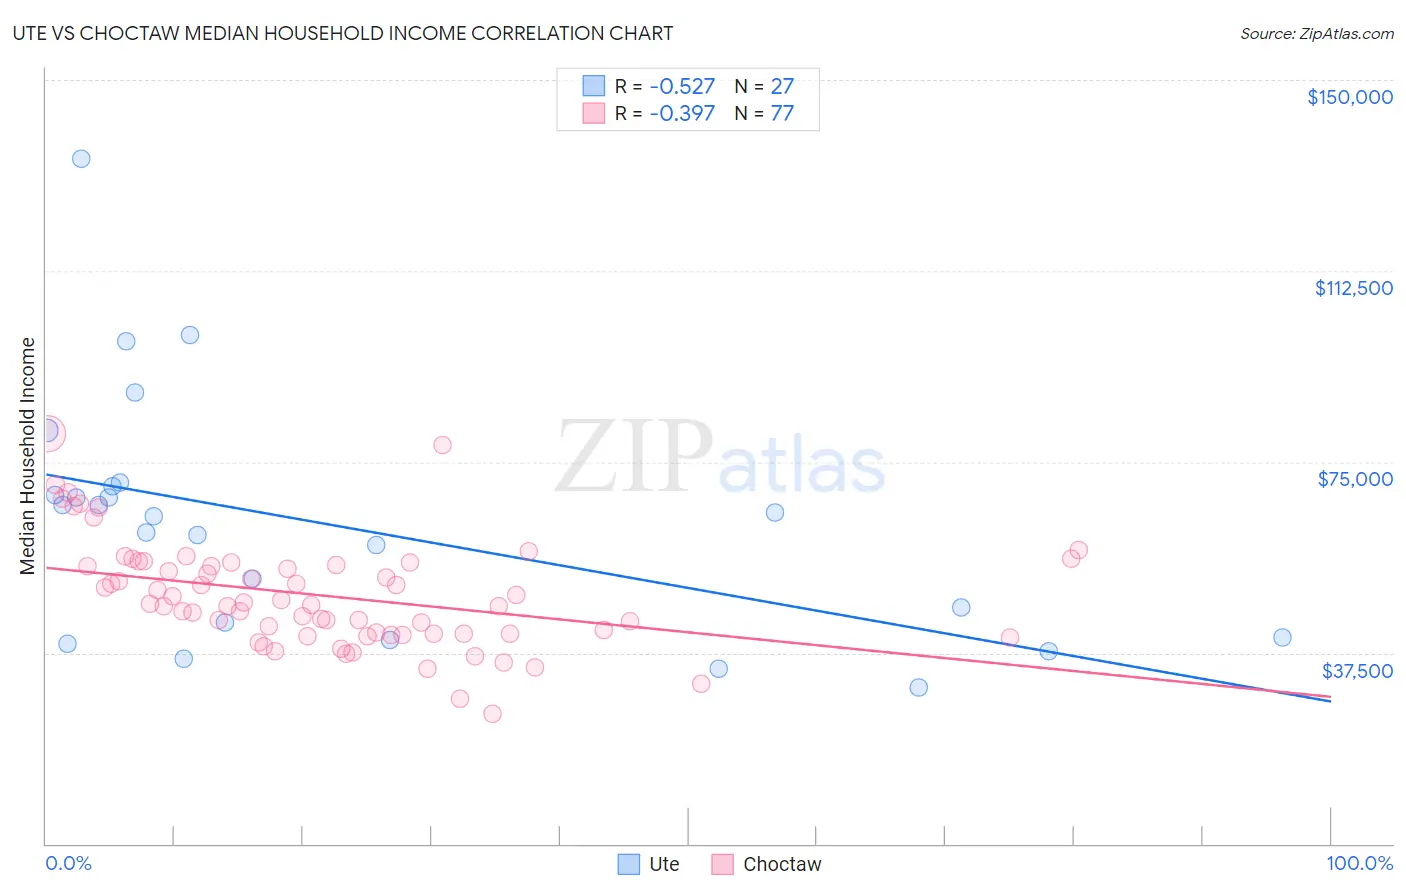
Ute vs Choctaw Median Household Income Correlation Chart
The statistical analysis conducted on geographies consisting of 55,657,610 people shows a substantial negative correlation between the proportion of Ute and median household income in the United States with a correlation coefficient (R) of -0.527 and weighted average of $72,402. Similarly, the statistical analysis conducted on geographies consisting of 269,579,280 people shows a mild negative correlation between the proportion of Choctaw and median household income in the United States with a correlation coefficient (R) of -0.397 and weighted average of $69,947, a difference of 3.5%.
Median Household Income Correlation Summary
| Measurement | Ute | Choctaw |
| Minimum | $30,694 | $25,625 |
| Maximum | $134,629 | $80,457 |
| Range | $103,935 | $54,832 |
| Mean | $62,668 | $48,786 |
| Median | $64,375 | $47,101 |
| Interquartile 25% (IQ1) | $40,417 | $41,215 |
| Interquartile 75% (IQ3) | $70,252 | $54,919 |
| Interquartile Range (IQR) | $29,835 | $13,705 |
| Standard Deviation (Sample) | $23,676 | $10,591 |
| Standard Deviation (Population) | $23,234 | $10,522 |
Demographics Similar to Ute and Choctaw by Median Household Income
In terms of median household income, the demographic groups most similar to Ute are Potawatomi ($72,576, a difference of 0.24%), Yakama ($72,225, a difference of 0.25%), Honduran ($72,588, a difference of 0.26%), Immigrants from Haiti ($72,599, a difference of 0.27%), and Immigrants from Caribbean ($71,860, a difference of 0.75%). Similarly, the demographic groups most similar to Choctaw are Chickasaw ($70,005, a difference of 0.080%), Colville ($70,094, a difference of 0.21%), Bahamian ($69,726, a difference of 0.32%), Yup'ik ($69,695, a difference of 0.36%), and Immigrants from Dominican Republic ($70,208, a difference of 0.37%).
| Demographics | Rating | Rank | Median Household Income |
| Immigrants | Haiti | 0.0 /100 | #304 | Tragic $72,599 |
| Hondurans | 0.0 /100 | #305 | Tragic $72,588 |
| Potawatomi | 0.0 /100 | #306 | Tragic $72,576 |
| Ute | 0.0 /100 | #307 | Tragic $72,402 |
| Yakama | 0.0 /100 | #308 | Tragic $72,225 |
| Immigrants | Caribbean | 0.0 /100 | #309 | Tragic $71,860 |
| U.S. Virgin Islanders | 0.0 /100 | #310 | Tragic $71,853 |
| Immigrants | Zaire | 0.0 /100 | #311 | Tragic $71,801 |
| Immigrants | Honduras | 0.0 /100 | #312 | Tragic $71,452 |
| Immigrants | Bahamas | 0.0 /100 | #313 | Tragic $71,349 |
| Dominicans | 0.0 /100 | #314 | Tragic $71,302 |
| Ottawa | 0.0 /100 | #315 | Tragic $70,984 |
| Apache | 0.0 /100 | #316 | Tragic $70,927 |
| Cajuns | 0.0 /100 | #317 | Tragic $70,605 |
| Chippewa | 0.0 /100 | #318 | Tragic $70,539 |
| Immigrants | Dominican Republic | 0.0 /100 | #319 | Tragic $70,208 |
| Colville | 0.0 /100 | #320 | Tragic $70,094 |
| Chickasaw | 0.0 /100 | #321 | Tragic $70,005 |
| Choctaw | 0.0 /100 | #322 | Tragic $69,947 |
| Bahamians | 0.0 /100 | #323 | Tragic $69,726 |
| Yup'ik | 0.0 /100 | #324 | Tragic $69,695 |