Central American Indian vs Osage Median Earnings
COMPARE
Central American Indian
Osage
Median Earnings
Median Earnings Comparison
Central American Indians
Osage
$41,474
MEDIAN EARNINGS
0.1/ 100
METRIC RATING
291st/ 347
METRIC RANK
$42,651
MEDIAN EARNINGS
0.5/ 100
METRIC RATING
270th/ 347
METRIC RANK
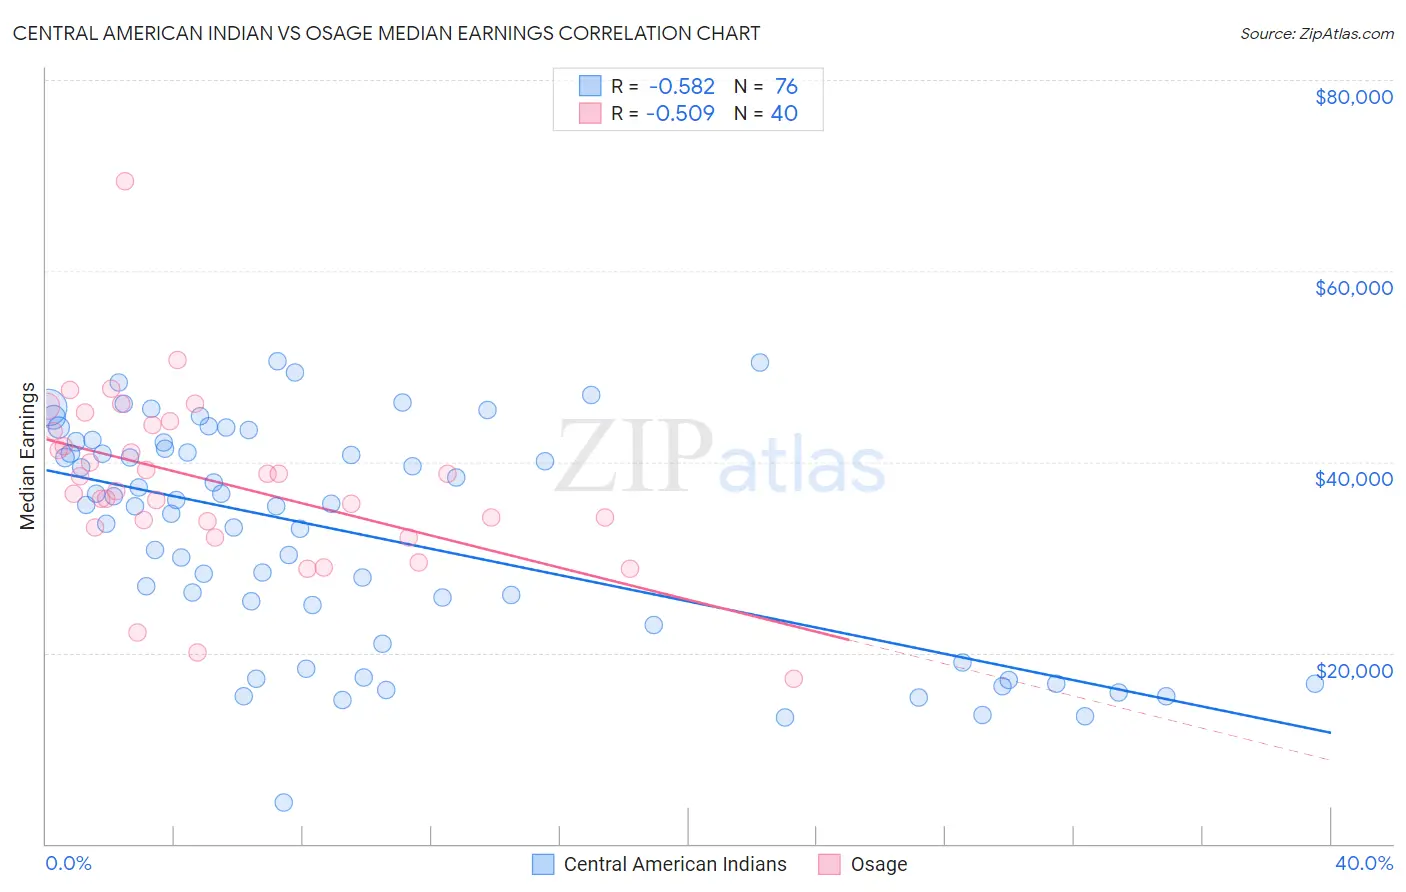
Central American Indian vs Osage Median Earnings Correlation Chart
The statistical analysis conducted on geographies consisting of 326,124,728 people shows a substantial negative correlation between the proportion of Central American Indians and median earnings in the United States with a correlation coefficient (R) of -0.582 and weighted average of $41,474. Similarly, the statistical analysis conducted on geographies consisting of 91,804,179 people shows a substantial negative correlation between the proportion of Osage and median earnings in the United States with a correlation coefficient (R) of -0.509 and weighted average of $42,651, a difference of 2.8%.
Median Earnings Correlation Summary
| Measurement | Central American Indian | Osage |
| Minimum | $4,300 | $17,308 |
| Maximum | $50,550 | $69,422 |
| Range | $46,250 | $52,114 |
| Mean | $32,321 | $37,848 |
| Median | $35,426 | $37,712 |
| Interquartile 25% (IQ1) | $21,944 | $33,454 |
| Interquartile 75% (IQ3) | $41,662 | $43,538 |
| Interquartile Range (IQR) | $19,717 | $10,084 |
| Standard Deviation (Sample) | $11,652 | $9,089 |
| Standard Deviation (Population) | $11,575 | $8,975 |
Similar Demographics by Median Earnings
Demographics Similar to Central American Indians by Median Earnings
In terms of median earnings, the demographic groups most similar to Central American Indians are U.S. Virgin Islander ($41,448, a difference of 0.060%), Paiute ($41,508, a difference of 0.080%), Comanche ($41,519, a difference of 0.11%), Immigrants from Dominican Republic ($41,554, a difference of 0.19%), and Immigrants from Zaire ($41,325, a difference of 0.36%).
| Demographics | Rating | Rank | Median Earnings |
| Blackfeet | 0.2 /100 | #284 | Tragic $41,822 |
| Immigrants | Nicaragua | 0.1 /100 | #285 | Tragic $41,737 |
| Mexican American Indians | 0.1 /100 | #286 | Tragic $41,719 |
| Indonesians | 0.1 /100 | #287 | Tragic $41,701 |
| Immigrants | Dominican Republic | 0.1 /100 | #288 | Tragic $41,554 |
| Comanche | 0.1 /100 | #289 | Tragic $41,519 |
| Paiute | 0.1 /100 | #290 | Tragic $41,508 |
| Central American Indians | 0.1 /100 | #291 | Tragic $41,474 |
| U.S. Virgin Islanders | 0.1 /100 | #292 | Tragic $41,448 |
| Immigrants | Zaire | 0.1 /100 | #293 | Tragic $41,325 |
| Potawatomi | 0.1 /100 | #294 | Tragic $41,288 |
| Bangladeshis | 0.1 /100 | #295 | Tragic $41,263 |
| Cherokee | 0.1 /100 | #296 | Tragic $41,252 |
| Guatemalans | 0.1 /100 | #297 | Tragic $41,205 |
| Immigrants | Micronesia | 0.1 /100 | #298 | Tragic $41,133 |
Demographics Similar to Osage by Median Earnings
In terms of median earnings, the demographic groups most similar to Osage are Pennsylvania German ($42,615, a difference of 0.090%), Belizean ($42,702, a difference of 0.12%), American ($42,742, a difference of 0.21%), Cree ($42,777, a difference of 0.29%), and Iroquois ($42,430, a difference of 0.52%).
| Demographics | Rating | Rank | Median Earnings |
| Inupiat | 0.8 /100 | #263 | Tragic $43,000 |
| Immigrants | Liberia | 0.7 /100 | #264 | Tragic $42,923 |
| Salvadorans | 0.7 /100 | #265 | Tragic $42,912 |
| Immigrants | Laos | 0.7 /100 | #266 | Tragic $42,884 |
| Cree | 0.6 /100 | #267 | Tragic $42,777 |
| Americans | 0.6 /100 | #268 | Tragic $42,742 |
| Belizeans | 0.5 /100 | #269 | Tragic $42,702 |
| Osage | 0.5 /100 | #270 | Tragic $42,651 |
| Pennsylvania Germans | 0.5 /100 | #271 | Tragic $42,615 |
| Iroquois | 0.4 /100 | #272 | Tragic $42,430 |
| Immigrants | Dominica | 0.4 /100 | #273 | Tragic $42,420 |
| Immigrants | El Salvador | 0.4 /100 | #274 | Tragic $42,413 |
| Immigrants | Belize | 0.3 /100 | #275 | Tragic $42,339 |
| Spanish Americans | 0.3 /100 | #276 | Tragic $42,316 |
| Central Americans | 0.3 /100 | #277 | Tragic $42,280 |