Central American Indian vs Spanish American Median Earnings
COMPARE
Central American Indian
Spanish American
Median Earnings
Median Earnings Comparison
Central American Indians
Spanish Americans
$41,474
MEDIAN EARNINGS
0.1/ 100
METRIC RATING
291st/ 347
METRIC RANK
$42,316
MEDIAN EARNINGS
0.3/ 100
METRIC RATING
276th/ 347
METRIC RANK
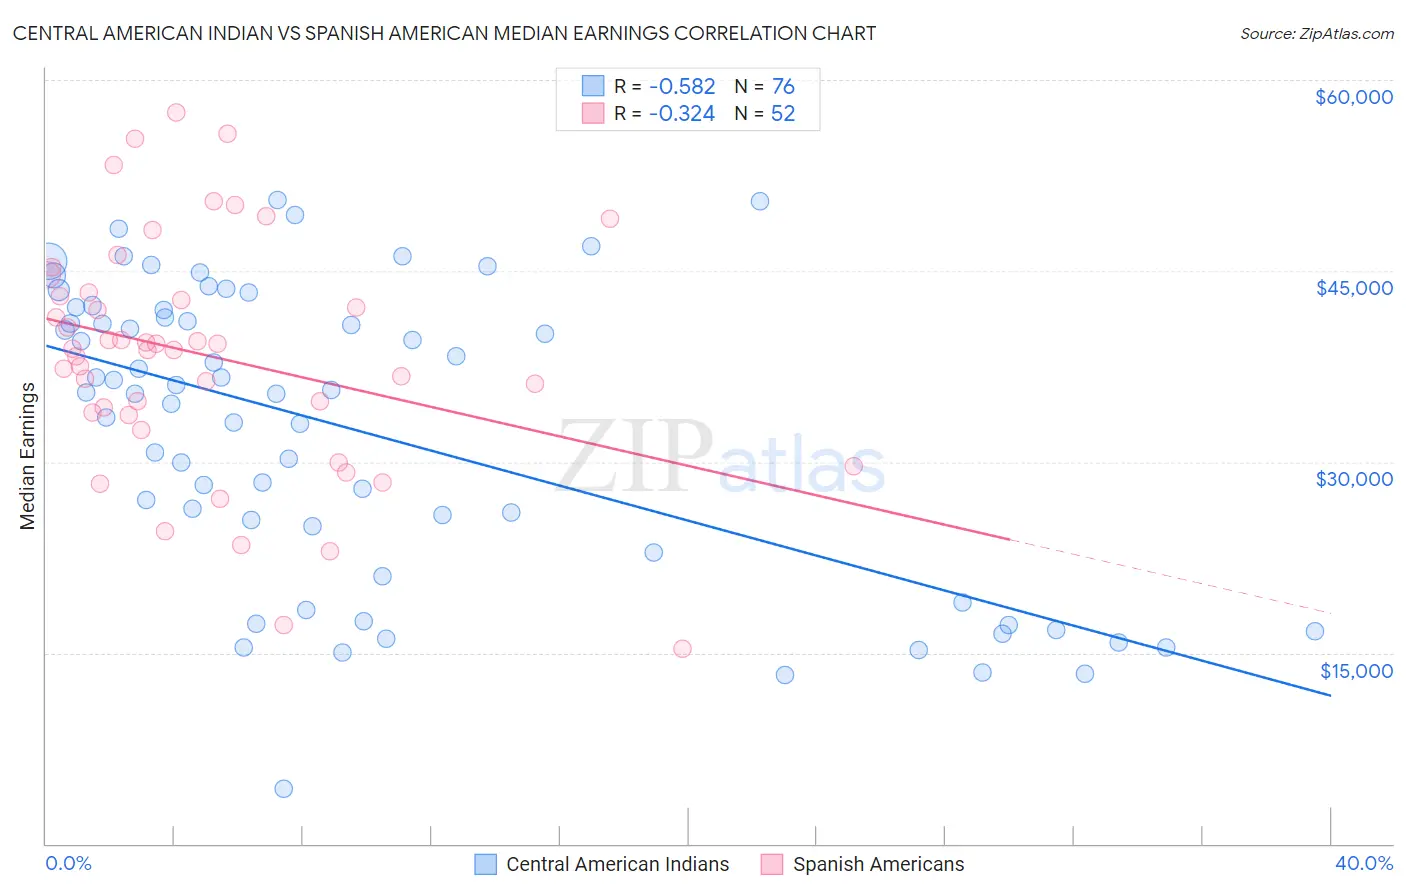
Central American Indian vs Spanish American Median Earnings Correlation Chart
The statistical analysis conducted on geographies consisting of 326,124,728 people shows a substantial negative correlation between the proportion of Central American Indians and median earnings in the United States with a correlation coefficient (R) of -0.582 and weighted average of $41,474. Similarly, the statistical analysis conducted on geographies consisting of 103,163,926 people shows a mild negative correlation between the proportion of Spanish Americans and median earnings in the United States with a correlation coefficient (R) of -0.324 and weighted average of $42,316, a difference of 2.0%.
Median Earnings Correlation Summary
| Measurement | Central American Indian | Spanish American |
| Minimum | $4,300 | $15,345 |
| Maximum | $50,550 | $57,404 |
| Range | $46,250 | $42,059 |
| Mean | $32,321 | $38,311 |
| Median | $35,426 | $38,863 |
| Interquartile 25% (IQ1) | $21,944 | $33,792 |
| Interquartile 75% (IQ3) | $41,662 | $43,155 |
| Interquartile Range (IQR) | $19,717 | $9,363 |
| Standard Deviation (Sample) | $11,652 | $9,272 |
| Standard Deviation (Population) | $11,575 | $9,182 |
Demographics Similar to Central American Indians and Spanish Americans by Median Earnings
In terms of median earnings, the demographic groups most similar to Central American Indians are U.S. Virgin Islander ($41,448, a difference of 0.060%), Paiute ($41,508, a difference of 0.080%), Comanche ($41,519, a difference of 0.11%), Immigrants from Dominican Republic ($41,554, a difference of 0.19%), and Immigrants from Zaire ($41,325, a difference of 0.36%). Similarly, the demographic groups most similar to Spanish Americans are Immigrants from Belize ($42,339, a difference of 0.060%), Central American ($42,280, a difference of 0.090%), Immigrants from El Salvador ($42,413, a difference of 0.23%), Immigrants from Dominica ($42,420, a difference of 0.25%), and Cajun ($42,189, a difference of 0.30%).
| Demographics | Rating | Rank | Median Earnings |
| Immigrants | Dominica | 0.4 /100 | #273 | Tragic $42,420 |
| Immigrants | El Salvador | 0.4 /100 | #274 | Tragic $42,413 |
| Immigrants | Belize | 0.3 /100 | #275 | Tragic $42,339 |
| Spanish Americans | 0.3 /100 | #276 | Tragic $42,316 |
| Central Americans | 0.3 /100 | #277 | Tragic $42,280 |
| Cajuns | 0.3 /100 | #278 | Tragic $42,189 |
| Colville | 0.2 /100 | #279 | Tragic $42,151 |
| Hmong | 0.2 /100 | #280 | Tragic $42,111 |
| Marshallese | 0.2 /100 | #281 | Tragic $41,969 |
| Africans | 0.2 /100 | #282 | Tragic $41,955 |
| Dominicans | 0.2 /100 | #283 | Tragic $41,864 |
| Blackfeet | 0.2 /100 | #284 | Tragic $41,822 |
| Immigrants | Nicaragua | 0.1 /100 | #285 | Tragic $41,737 |
| Mexican American Indians | 0.1 /100 | #286 | Tragic $41,719 |
| Indonesians | 0.1 /100 | #287 | Tragic $41,701 |
| Immigrants | Dominican Republic | 0.1 /100 | #288 | Tragic $41,554 |
| Comanche | 0.1 /100 | #289 | Tragic $41,519 |
| Paiute | 0.1 /100 | #290 | Tragic $41,508 |
| Central American Indians | 0.1 /100 | #291 | Tragic $41,474 |
| U.S. Virgin Islanders | 0.1 /100 | #292 | Tragic $41,448 |
| Immigrants | Zaire | 0.1 /100 | #293 | Tragic $41,325 |