Central American Indian vs Palestinian Median Earnings
COMPARE
Central American Indian
Palestinian
Median Earnings
Median Earnings Comparison
Central American Indians
Palestinians
$41,474
MEDIAN EARNINGS
0.1/ 100
METRIC RATING
291st/ 347
METRIC RANK
$49,209
MEDIAN EARNINGS
98.0/ 100
METRIC RATING
108th/ 347
METRIC RANK
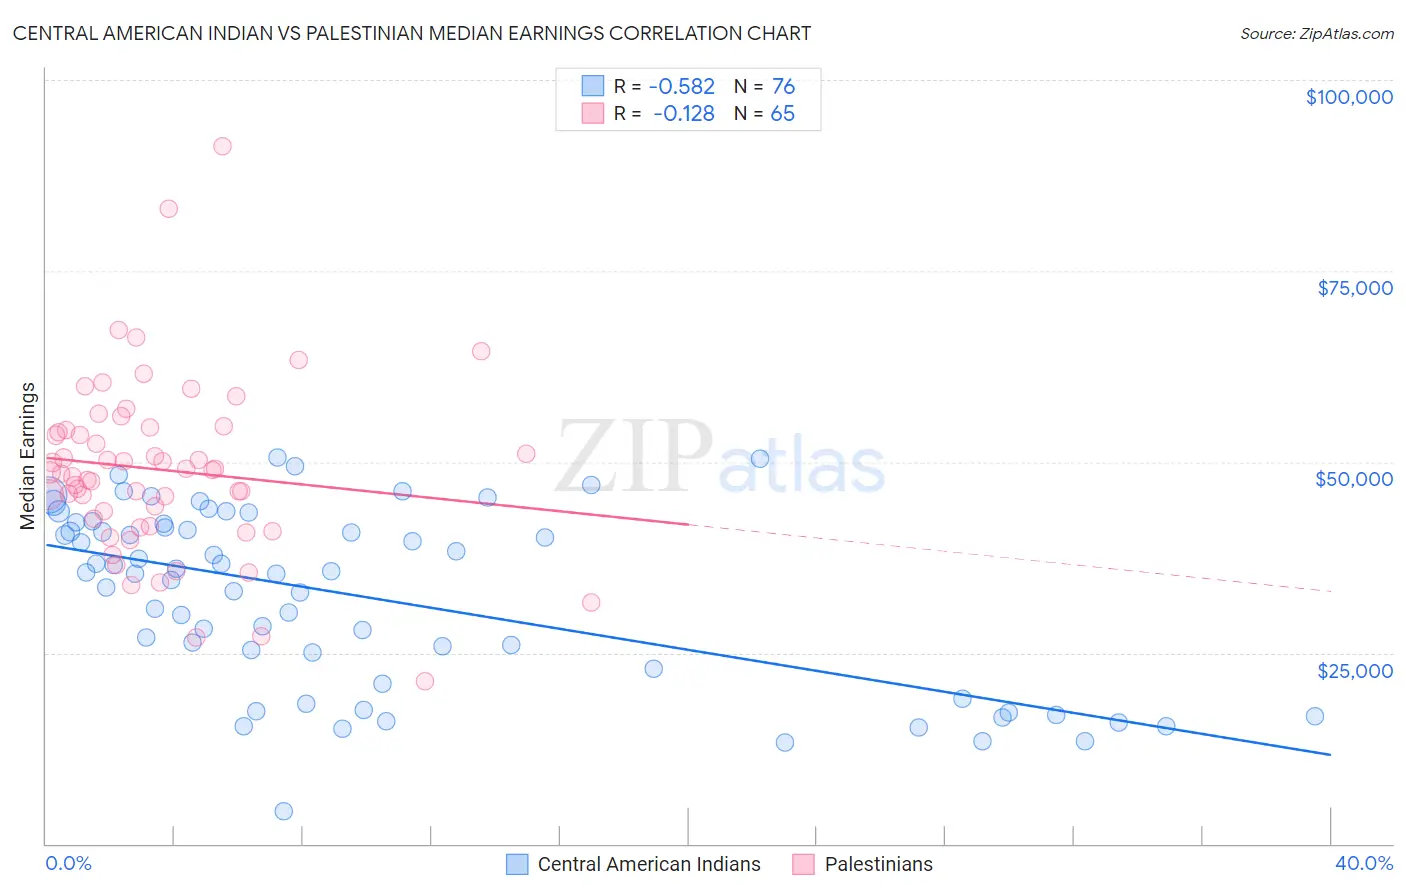
Central American Indian vs Palestinian Median Earnings Correlation Chart
The statistical analysis conducted on geographies consisting of 326,124,728 people shows a substantial negative correlation between the proportion of Central American Indians and median earnings in the United States with a correlation coefficient (R) of -0.582 and weighted average of $41,474. Similarly, the statistical analysis conducted on geographies consisting of 216,457,574 people shows a poor negative correlation between the proportion of Palestinians and median earnings in the United States with a correlation coefficient (R) of -0.128 and weighted average of $49,209, a difference of 18.6%.
Median Earnings Correlation Summary
| Measurement | Central American Indian | Palestinian |
| Minimum | $4,300 | $21,204 |
| Maximum | $50,550 | $91,328 |
| Range | $46,250 | $70,124 |
| Mean | $32,321 | $48,950 |
| Median | $35,426 | $48,622 |
| Interquartile 25% (IQ1) | $21,944 | $42,020 |
| Interquartile 75% (IQ3) | $41,662 | $54,336 |
| Interquartile Range (IQR) | $19,717 | $12,316 |
| Standard Deviation (Sample) | $11,652 | $11,660 |
| Standard Deviation (Population) | $11,575 | $11,570 |
Similar Demographics by Median Earnings
Demographics Similar to Central American Indians by Median Earnings
In terms of median earnings, the demographic groups most similar to Central American Indians are U.S. Virgin Islander ($41,448, a difference of 0.060%), Paiute ($41,508, a difference of 0.080%), Comanche ($41,519, a difference of 0.11%), Immigrants from Dominican Republic ($41,554, a difference of 0.19%), and Immigrants from Zaire ($41,325, a difference of 0.36%).
| Demographics | Rating | Rank | Median Earnings |
| Blackfeet | 0.2 /100 | #284 | Tragic $41,822 |
| Immigrants | Nicaragua | 0.1 /100 | #285 | Tragic $41,737 |
| Mexican American Indians | 0.1 /100 | #286 | Tragic $41,719 |
| Indonesians | 0.1 /100 | #287 | Tragic $41,701 |
| Immigrants | Dominican Republic | 0.1 /100 | #288 | Tragic $41,554 |
| Comanche | 0.1 /100 | #289 | Tragic $41,519 |
| Paiute | 0.1 /100 | #290 | Tragic $41,508 |
| Central American Indians | 0.1 /100 | #291 | Tragic $41,474 |
| U.S. Virgin Islanders | 0.1 /100 | #292 | Tragic $41,448 |
| Immigrants | Zaire | 0.1 /100 | #293 | Tragic $41,325 |
| Potawatomi | 0.1 /100 | #294 | Tragic $41,288 |
| Bangladeshis | 0.1 /100 | #295 | Tragic $41,263 |
| Cherokee | 0.1 /100 | #296 | Tragic $41,252 |
| Guatemalans | 0.1 /100 | #297 | Tragic $41,205 |
| Immigrants | Micronesia | 0.1 /100 | #298 | Tragic $41,133 |
Demographics Similar to Palestinians by Median Earnings
In terms of median earnings, the demographic groups most similar to Palestinians are Immigrants from Morocco ($49,368, a difference of 0.32%), Immigrants from Albania ($49,377, a difference of 0.34%), Immigrants from Western Asia ($49,389, a difference of 0.37%), Immigrants from Brazil ($49,463, a difference of 0.52%), and Syrian ($48,934, a difference of 0.56%).
| Demographics | Rating | Rank | Median Earnings |
| Jordanians | 98.9 /100 | #101 | Exceptional $49,632 |
| Ethiopians | 98.8 /100 | #102 | Exceptional $49,572 |
| Austrians | 98.7 /100 | #103 | Exceptional $49,501 |
| Immigrants | Brazil | 98.6 /100 | #104 | Exceptional $49,463 |
| Immigrants | Western Asia | 98.4 /100 | #105 | Exceptional $49,389 |
| Immigrants | Albania | 98.4 /100 | #106 | Exceptional $49,377 |
| Immigrants | Morocco | 98.4 /100 | #107 | Exceptional $49,368 |
| Palestinians | 98.0 /100 | #108 | Exceptional $49,209 |
| Syrians | 97.1 /100 | #109 | Exceptional $48,934 |
| Immigrants | Ethiopia | 97.1 /100 | #110 | Exceptional $48,924 |
| Immigrants | Zimbabwe | 97.0 /100 | #111 | Exceptional $48,913 |
| Northern Europeans | 96.9 /100 | #112 | Exceptional $48,887 |
| Immigrants | Kuwait | 96.8 /100 | #113 | Exceptional $48,861 |
| Moroccans | 96.7 /100 | #114 | Exceptional $48,838 |
| Chinese | 96.7 /100 | #115 | Exceptional $48,836 |