Central American Indian vs Colombian Median Earnings
COMPARE
Central American Indian
Colombian
Median Earnings
Median Earnings Comparison
Central American Indians
Colombians
$41,474
MEDIAN EARNINGS
0.1/ 100
METRIC RATING
291st/ 347
METRIC RANK
$46,349
MEDIAN EARNINGS
47.1/ 100
METRIC RATING
178th/ 347
METRIC RANK
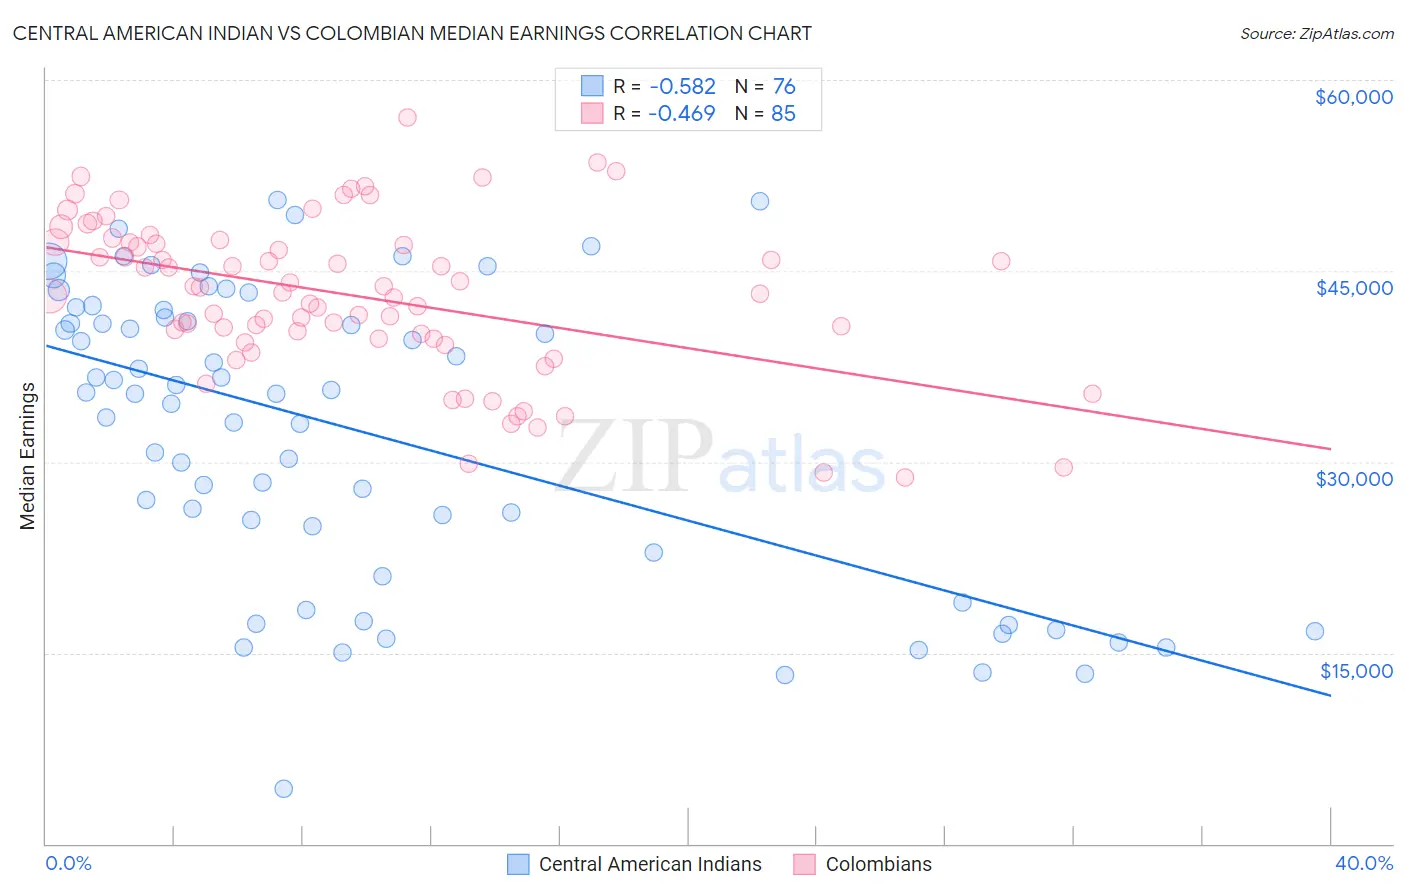
Central American Indian vs Colombian Median Earnings Correlation Chart
The statistical analysis conducted on geographies consisting of 326,124,728 people shows a substantial negative correlation between the proportion of Central American Indians and median earnings in the United States with a correlation coefficient (R) of -0.582 and weighted average of $41,474. Similarly, the statistical analysis conducted on geographies consisting of 419,670,347 people shows a moderate negative correlation between the proportion of Colombians and median earnings in the United States with a correlation coefficient (R) of -0.469 and weighted average of $46,349, a difference of 11.7%.
Median Earnings Correlation Summary
| Measurement | Central American Indian | Colombian |
| Minimum | $4,300 | $28,750 |
| Maximum | $50,550 | $57,032 |
| Range | $46,250 | $28,282 |
| Mean | $32,321 | $43,048 |
| Median | $35,426 | $43,271 |
| Interquartile 25% (IQ1) | $21,944 | $39,637 |
| Interquartile 75% (IQ3) | $41,662 | $47,254 |
| Interquartile Range (IQR) | $19,717 | $7,617 |
| Standard Deviation (Sample) | $11,652 | $6,158 |
| Standard Deviation (Population) | $11,575 | $6,121 |
Similar Demographics by Median Earnings
Demographics Similar to Central American Indians by Median Earnings
In terms of median earnings, the demographic groups most similar to Central American Indians are U.S. Virgin Islander ($41,448, a difference of 0.060%), Paiute ($41,508, a difference of 0.080%), Comanche ($41,519, a difference of 0.11%), Immigrants from Dominican Republic ($41,554, a difference of 0.19%), and Immigrants from Zaire ($41,325, a difference of 0.36%).
| Demographics | Rating | Rank | Median Earnings |
| Blackfeet | 0.2 /100 | #284 | Tragic $41,822 |
| Immigrants | Nicaragua | 0.1 /100 | #285 | Tragic $41,737 |
| Mexican American Indians | 0.1 /100 | #286 | Tragic $41,719 |
| Indonesians | 0.1 /100 | #287 | Tragic $41,701 |
| Immigrants | Dominican Republic | 0.1 /100 | #288 | Tragic $41,554 |
| Comanche | 0.1 /100 | #289 | Tragic $41,519 |
| Paiute | 0.1 /100 | #290 | Tragic $41,508 |
| Central American Indians | 0.1 /100 | #291 | Tragic $41,474 |
| U.S. Virgin Islanders | 0.1 /100 | #292 | Tragic $41,448 |
| Immigrants | Zaire | 0.1 /100 | #293 | Tragic $41,325 |
| Potawatomi | 0.1 /100 | #294 | Tragic $41,288 |
| Bangladeshis | 0.1 /100 | #295 | Tragic $41,263 |
| Cherokee | 0.1 /100 | #296 | Tragic $41,252 |
| Guatemalans | 0.1 /100 | #297 | Tragic $41,205 |
| Immigrants | Micronesia | 0.1 /100 | #298 | Tragic $41,133 |
Demographics Similar to Colombians by Median Earnings
In terms of median earnings, the demographic groups most similar to Colombians are English ($46,334, a difference of 0.030%), Puget Sound Salish ($46,333, a difference of 0.040%), Immigrants from Cameroon ($46,329, a difference of 0.040%), Belgian ($46,375, a difference of 0.060%), and Swiss ($46,315, a difference of 0.070%).
| Demographics | Rating | Rank | Median Earnings |
| Scottish | 51.1 /100 | #171 | Average $46,463 |
| Kenyans | 51.0 /100 | #172 | Average $46,462 |
| Ghanaians | 50.3 /100 | #173 | Average $46,440 |
| Scandinavians | 50.0 /100 | #174 | Average $46,433 |
| Basques | 48.8 /100 | #175 | Average $46,399 |
| Danes | 48.6 /100 | #176 | Average $46,392 |
| Belgians | 48.0 /100 | #177 | Average $46,375 |
| Colombians | 47.1 /100 | #178 | Average $46,349 |
| English | 46.5 /100 | #179 | Average $46,334 |
| Puget Sound Salish | 46.5 /100 | #180 | Average $46,333 |
| Immigrants | Cameroon | 46.4 /100 | #181 | Average $46,329 |
| Swiss | 45.9 /100 | #182 | Average $46,315 |
| French | 45.2 /100 | #183 | Average $46,296 |
| Immigrants | Kenya | 42.4 /100 | #184 | Average $46,214 |
| Uruguayans | 41.6 /100 | #185 | Average $46,190 |