Celtic vs Thai Per Capita Income
COMPARE
Celtic
Thai
Per Capita Income
Per Capita Income Comparison
Celtics
Thais
$43,621
PER CAPITA INCOME
48.9/ 100
METRIC RATING
175th/ 347
METRIC RANK
$54,307
PER CAPITA INCOME
100.0/ 100
METRIC RATING
18th/ 347
METRIC RANK
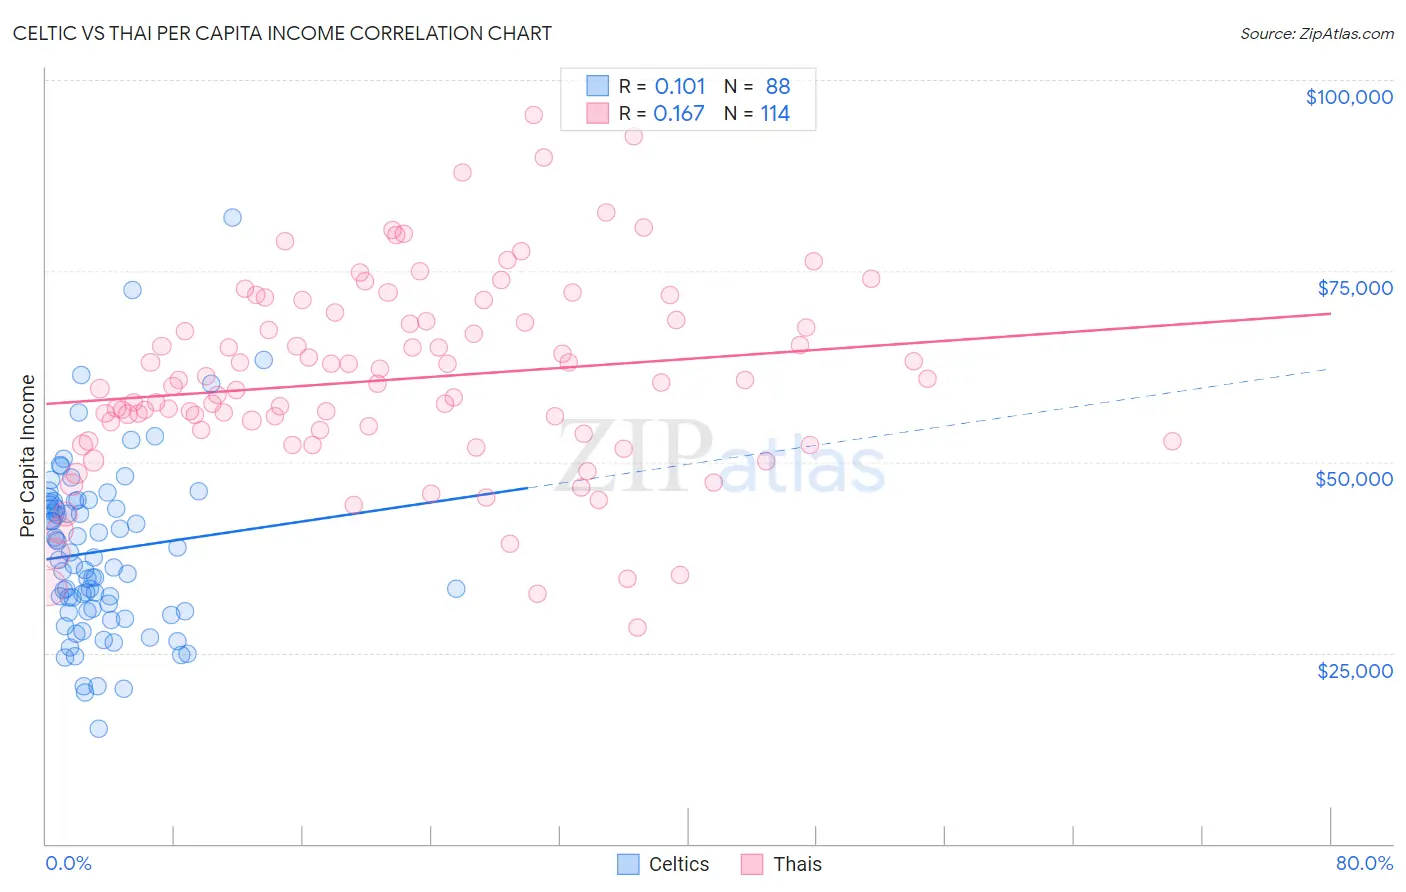
Celtic vs Thai Per Capita Income Correlation Chart
The statistical analysis conducted on geographies consisting of 168,877,272 people shows a poor positive correlation between the proportion of Celtics and per capita income in the United States with a correlation coefficient (R) of 0.101 and weighted average of $43,621. Similarly, the statistical analysis conducted on geographies consisting of 475,818,965 people shows a poor positive correlation between the proportion of Thais and per capita income in the United States with a correlation coefficient (R) of 0.167 and weighted average of $54,307, a difference of 24.5%.
Per Capita Income Correlation Summary
| Measurement | Celtic | Thai |
| Minimum | $15,033 | $28,291 |
| Maximum | $81,943 | $95,364 |
| Range | $66,910 | $67,073 |
| Mean | $38,287 | $60,793 |
| Median | $36,864 | $60,110 |
| Interquartile 25% (IQ1) | $30,511 | $53,762 |
| Interquartile 75% (IQ3) | $44,540 | $68,395 |
| Interquartile Range (IQR) | $14,029 | $14,633 |
| Standard Deviation (Sample) | $11,448 | $12,693 |
| Standard Deviation (Population) | $11,383 | $12,637 |
Similar Demographics by Per Capita Income
Demographics Similar to Celtics by Per Capita Income
In terms of per capita income, the demographic groups most similar to Celtics are Colombian ($43,661, a difference of 0.090%), French ($43,685, a difference of 0.15%), Immigrants from South Eastern Asia ($43,539, a difference of 0.19%), Tlingit-Haida ($43,516, a difference of 0.24%), and Immigrants from Costa Rica ($43,464, a difference of 0.36%).
| Demographics | Rating | Rank | Per Capita Income |
| Belgians | 58.1 /100 | #168 | Average $43,951 |
| Immigrants | Peru | 55.3 /100 | #169 | Average $43,852 |
| Scandinavians | 55.2 /100 | #170 | Average $43,848 |
| Immigrants | Eastern Africa | 54.9 /100 | #171 | Average $43,838 |
| Czechoslovakians | 54.1 /100 | #172 | Average $43,806 |
| French | 50.7 /100 | #173 | Average $43,685 |
| Colombians | 50.0 /100 | #174 | Average $43,661 |
| Celtics | 48.9 /100 | #175 | Average $43,621 |
| Immigrants | South Eastern Asia | 46.6 /100 | #176 | Average $43,539 |
| Tlingit-Haida | 45.9 /100 | #177 | Average $43,516 |
| Immigrants | Costa Rica | 44.5 /100 | #178 | Average $43,464 |
| Finns | 44.4 /100 | #179 | Average $43,461 |
| Sierra Leoneans | 42.9 /100 | #180 | Average $43,405 |
| Welsh | 38.2 /100 | #181 | Fair $43,233 |
| Immigrants | Vietnam | 38.1 /100 | #182 | Fair $43,229 |
Demographics Similar to Thais by Per Capita Income
In terms of per capita income, the demographic groups most similar to Thais are Immigrants from China ($54,264, a difference of 0.080%), Soviet Union ($54,202, a difference of 0.19%), Immigrants from Northern Europe ($54,159, a difference of 0.27%), Immigrants from France ($54,557, a difference of 0.46%), and Indian (Asian) ($53,874, a difference of 0.80%).
| Demographics | Rating | Rank | Per Capita Income |
| Eastern Europeans | 100.0 /100 | #11 | Exceptional $55,780 |
| Immigrants | Sweden | 100.0 /100 | #12 | Exceptional $55,582 |
| Immigrants | India | 100.0 /100 | #13 | Exceptional $55,268 |
| Immigrants | Belgium | 100.0 /100 | #14 | Exceptional $55,082 |
| Cypriots | 100.0 /100 | #15 | Exceptional $54,899 |
| Immigrants | Switzerland | 100.0 /100 | #16 | Exceptional $54,866 |
| Immigrants | France | 100.0 /100 | #17 | Exceptional $54,557 |
| Thais | 100.0 /100 | #18 | Exceptional $54,307 |
| Immigrants | China | 100.0 /100 | #19 | Exceptional $54,264 |
| Soviet Union | 100.0 /100 | #20 | Exceptional $54,202 |
| Immigrants | Northern Europe | 100.0 /100 | #21 | Exceptional $54,159 |
| Indians (Asian) | 100.0 /100 | #22 | Exceptional $53,874 |
| Immigrants | Eastern Asia | 100.0 /100 | #23 | Exceptional $53,806 |
| Immigrants | Denmark | 100.0 /100 | #24 | Exceptional $53,799 |
| Immigrants | Japan | 100.0 /100 | #25 | Exceptional $53,359 |