Immigrants from Asia vs Asian Per Capita Income
COMPARE
Immigrants from Asia
Asian
Per Capita Income
Per Capita Income Comparison
Immigrants from Asia
Asians
$49,741
PER CAPITA INCOME
99.9/ 100
METRIC RATING
62nd/ 347
METRIC RANK
$50,057
PER CAPITA INCOME
99.9/ 100
METRIC RATING
56th/ 347
METRIC RANK
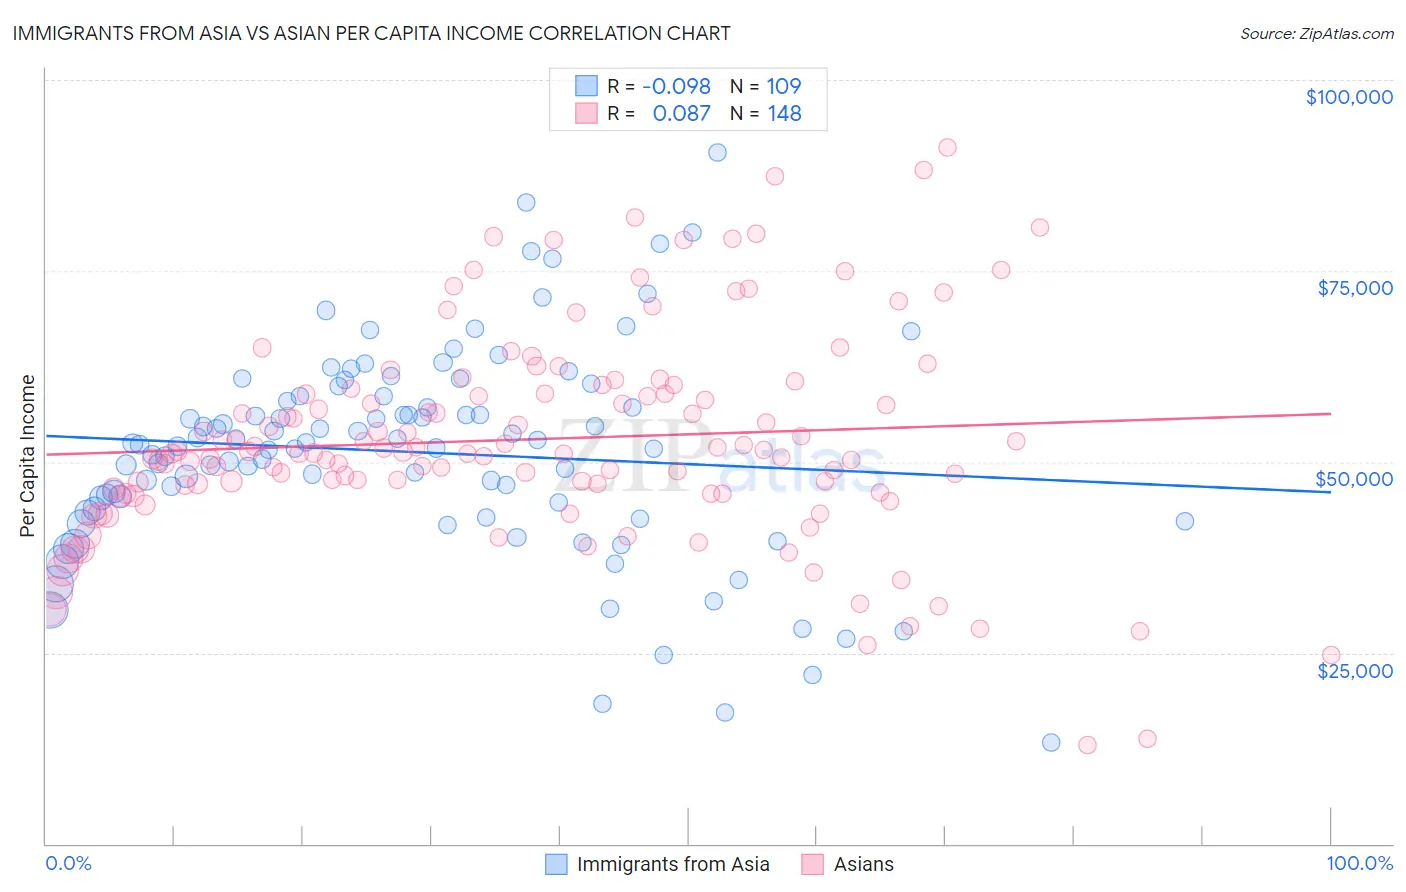
Immigrants from Asia vs Asian Per Capita Income Correlation Chart
The statistical analysis conducted on geographies consisting of 549,218,317 people shows a slight negative correlation between the proportion of Immigrants from Asia and per capita income in the United States with a correlation coefficient (R) of -0.098 and weighted average of $49,741. Similarly, the statistical analysis conducted on geographies consisting of 550,984,990 people shows a slight positive correlation between the proportion of Asians and per capita income in the United States with a correlation coefficient (R) of 0.087 and weighted average of $50,057, a difference of 0.64%.
Per Capita Income Correlation Summary
| Measurement | Immigrants from Asia | Asian |
| Minimum | $13,219 | $12,941 |
| Maximum | $90,491 | $91,125 |
| Range | $77,273 | $78,184 |
| Mean | $51,284 | $52,955 |
| Median | $52,258 | $51,252 |
| Interquartile 25% (IQ1) | $43,660 | $46,204 |
| Interquartile 75% (IQ3) | $58,564 | $59,246 |
| Interquartile Range (IQR) | $14,904 | $13,041 |
| Standard Deviation (Sample) | $13,798 | $13,804 |
| Standard Deviation (Population) | $13,734 | $13,757 |
Demographics Similar to Immigrants from Asia and Asians by Per Capita Income
In terms of per capita income, the demographic groups most similar to Immigrants from Asia are Maltese ($49,640, a difference of 0.20%), Immigrants from Argentina ($49,627, a difference of 0.23%), Argentinean ($49,862, a difference of 0.24%), Bhutanese ($49,894, a difference of 0.31%), and Immigrants from Scotland ($49,893, a difference of 0.31%). Similarly, the demographic groups most similar to Asians are Immigrants from Western Europe ($50,065, a difference of 0.020%), South African ($50,044, a difference of 0.030%), Immigrants from Malaysia ($49,983, a difference of 0.15%), Bhutanese ($49,894, a difference of 0.33%), and Immigrants from Scotland ($49,893, a difference of 0.33%).
| Demographics | Rating | Rank | Per Capita Income |
| New Zealanders | 100.0 /100 | #49 | Exceptional $50,575 |
| Immigrants | Sri Lanka | 100.0 /100 | #50 | Exceptional $50,555 |
| Immigrants | Netherlands | 100.0 /100 | #51 | Exceptional $50,458 |
| Immigrants | Croatia | 99.9 /100 | #52 | Exceptional $50,417 |
| Paraguayans | 99.9 /100 | #53 | Exceptional $50,385 |
| Immigrants | Belarus | 99.9 /100 | #54 | Exceptional $50,303 |
| Immigrants | Western Europe | 99.9 /100 | #55 | Exceptional $50,065 |
| Asians | 99.9 /100 | #56 | Exceptional $50,057 |
| South Africans | 99.9 /100 | #57 | Exceptional $50,044 |
| Immigrants | Malaysia | 99.9 /100 | #58 | Exceptional $49,983 |
| Bhutanese | 99.9 /100 | #59 | Exceptional $49,894 |
| Immigrants | Scotland | 99.9 /100 | #60 | Exceptional $49,893 |
| Argentineans | 99.9 /100 | #61 | Exceptional $49,862 |
| Immigrants | Asia | 99.9 /100 | #62 | Exceptional $49,741 |
| Maltese | 99.9 /100 | #63 | Exceptional $49,640 |
| Immigrants | Argentina | 99.9 /100 | #64 | Exceptional $49,627 |
| Bolivians | 99.9 /100 | #65 | Exceptional $49,526 |
| Immigrants | Bulgaria | 99.9 /100 | #66 | Exceptional $49,482 |
| Immigrants | Romania | 99.9 /100 | #67 | Exceptional $49,463 |
| Lithuanians | 99.8 /100 | #68 | Exceptional $49,448 |
| Immigrants | Canada | 99.8 /100 | #69 | Exceptional $49,412 |