Immigrants from Serbia vs Asian Per Capita Income
COMPARE
Immigrants from Serbia
Asian
Per Capita Income
Per Capita Income Comparison
Immigrants from Serbia
Asians
$50,810
PER CAPITA INCOME
100.0/ 100
METRIC RATING
48th/ 347
METRIC RANK
$50,057
PER CAPITA INCOME
99.9/ 100
METRIC RATING
56th/ 347
METRIC RANK
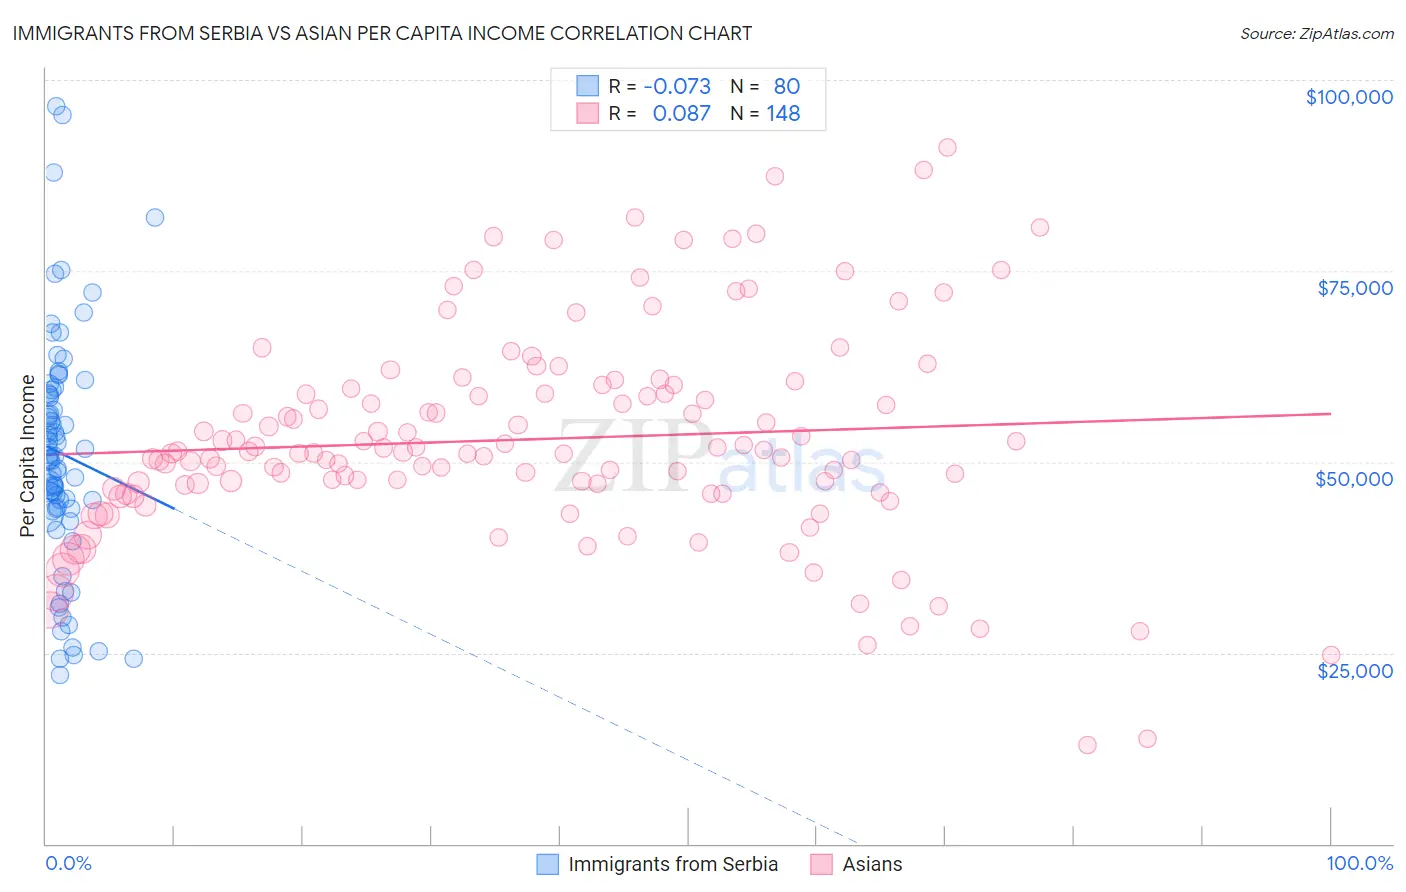
Immigrants from Serbia vs Asian Per Capita Income Correlation Chart
The statistical analysis conducted on geographies consisting of 131,748,543 people shows a slight negative correlation between the proportion of Immigrants from Serbia and per capita income in the United States with a correlation coefficient (R) of -0.073 and weighted average of $50,810. Similarly, the statistical analysis conducted on geographies consisting of 550,984,990 people shows a slight positive correlation between the proportion of Asians and per capita income in the United States with a correlation coefficient (R) of 0.087 and weighted average of $50,057, a difference of 1.5%.
Per Capita Income Correlation Summary
| Measurement | Immigrants from Serbia | Asian |
| Minimum | $22,149 | $12,941 |
| Maximum | $96,565 | $91,125 |
| Range | $74,416 | $78,184 |
| Mean | $51,095 | $52,955 |
| Median | $50,532 | $51,252 |
| Interquartile 25% (IQ1) | $43,814 | $46,204 |
| Interquartile 75% (IQ3) | $59,208 | $59,246 |
| Interquartile Range (IQR) | $15,394 | $13,041 |
| Standard Deviation (Sample) | $15,421 | $13,804 |
| Standard Deviation (Population) | $15,324 | $13,757 |
Demographics Similar to Immigrants from Serbia and Asians by Per Capita Income
In terms of per capita income, the demographic groups most similar to Immigrants from Serbia are Bulgarian ($50,906, a difference of 0.19%), Immigrants from Latvia ($50,914, a difference of 0.21%), Immigrants from Spain ($50,933, a difference of 0.24%), Immigrants from Europe ($50,950, a difference of 0.28%), and New Zealander ($50,575, a difference of 0.46%). Similarly, the demographic groups most similar to Asians are Immigrants from Western Europe ($50,065, a difference of 0.020%), South African ($50,044, a difference of 0.030%), Immigrants from Malaysia ($49,983, a difference of 0.15%), Bhutanese ($49,894, a difference of 0.33%), and Immigrants from Scotland ($49,893, a difference of 0.33%).
| Demographics | Rating | Rank | Per Capita Income |
| Immigrants | Turkey | 100.0 /100 | #42 | Exceptional $51,368 |
| Immigrants | Lithuania | 100.0 /100 | #43 | Exceptional $51,361 |
| Immigrants | Europe | 100.0 /100 | #44 | Exceptional $50,950 |
| Immigrants | Spain | 100.0 /100 | #45 | Exceptional $50,933 |
| Immigrants | Latvia | 100.0 /100 | #46 | Exceptional $50,914 |
| Bulgarians | 100.0 /100 | #47 | Exceptional $50,906 |
| Immigrants | Serbia | 100.0 /100 | #48 | Exceptional $50,810 |
| New Zealanders | 100.0 /100 | #49 | Exceptional $50,575 |
| Immigrants | Sri Lanka | 100.0 /100 | #50 | Exceptional $50,555 |
| Immigrants | Netherlands | 100.0 /100 | #51 | Exceptional $50,458 |
| Immigrants | Croatia | 99.9 /100 | #52 | Exceptional $50,417 |
| Paraguayans | 99.9 /100 | #53 | Exceptional $50,385 |
| Immigrants | Belarus | 99.9 /100 | #54 | Exceptional $50,303 |
| Immigrants | Western Europe | 99.9 /100 | #55 | Exceptional $50,065 |
| Asians | 99.9 /100 | #56 | Exceptional $50,057 |
| South Africans | 99.9 /100 | #57 | Exceptional $50,044 |
| Immigrants | Malaysia | 99.9 /100 | #58 | Exceptional $49,983 |
| Bhutanese | 99.9 /100 | #59 | Exceptional $49,894 |
| Immigrants | Scotland | 99.9 /100 | #60 | Exceptional $49,893 |
| Argentineans | 99.9 /100 | #61 | Exceptional $49,862 |
| Immigrants | Asia | 99.9 /100 | #62 | Exceptional $49,741 |