Cambodian vs Paraguayan Median Family Income
COMPARE
Cambodian
Paraguayan
Median Family Income
Median Family Income Comparison
Cambodians
Paraguayans
$117,780
MEDIAN FAMILY INCOME
100.0/ 100
METRIC RATING
44th/ 347
METRIC RANK
$114,016
MEDIAN FAMILY INCOME
99.7/ 100
METRIC RATING
66th/ 347
METRIC RANK
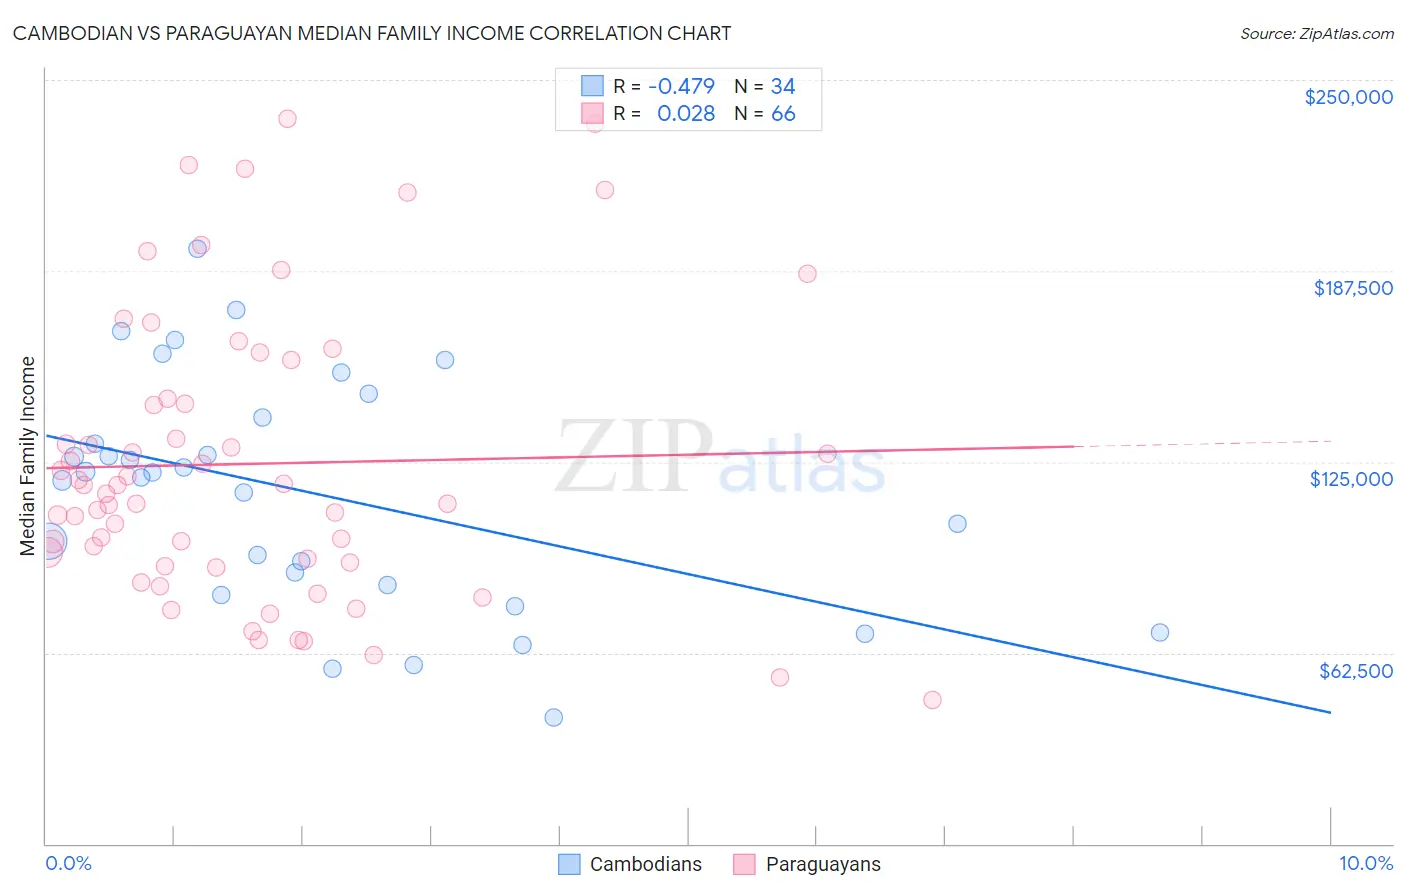
Cambodian vs Paraguayan Median Family Income Correlation Chart
The statistical analysis conducted on geographies consisting of 102,461,045 people shows a moderate negative correlation between the proportion of Cambodians and median family income in the United States with a correlation coefficient (R) of -0.479 and weighted average of $117,780. Similarly, the statistical analysis conducted on geographies consisting of 95,094,698 people shows no correlation between the proportion of Paraguayans and median family income in the United States with a correlation coefficient (R) of 0.028 and weighted average of $114,016, a difference of 3.3%.
Median Family Income Correlation Summary
| Measurement | Cambodian | Paraguayan |
| Minimum | $41,250 | $47,188 |
| Maximum | $194,752 | $237,188 |
| Range | $153,502 | $190,000 |
| Mean | $114,811 | $124,379 |
| Median | $120,749 | $115,994 |
| Interquartile 25% (IQ1) | $84,853 | $91,993 |
| Interquartile 75% (IQ3) | $139,722 | $145,560 |
| Interquartile Range (IQR) | $54,869 | $53,567 |
| Standard Deviation (Sample) | $37,903 | $46,622 |
| Standard Deviation (Population) | $37,342 | $46,268 |
Similar Demographics by Median Family Income
Demographics Similar to Cambodians by Median Family Income
In terms of median family income, the demographic groups most similar to Cambodians are Bulgarian ($117,818, a difference of 0.030%), Immigrants from Bolivia ($117,912, a difference of 0.11%), Estonian ($118,013, a difference of 0.20%), Immigrants from Lithuania ($118,053, a difference of 0.23%), and Immigrants from Greece ($117,344, a difference of 0.37%).
| Demographics | Rating | Rank | Median Family Income |
| Australians | 100.0 /100 | #37 | Exceptional $118,440 |
| Immigrants | Turkey | 100.0 /100 | #38 | Exceptional $118,325 |
| Immigrants | Asia | 100.0 /100 | #39 | Exceptional $118,291 |
| Immigrants | Lithuania | 100.0 /100 | #40 | Exceptional $118,053 |
| Estonians | 100.0 /100 | #41 | Exceptional $118,013 |
| Immigrants | Bolivia | 100.0 /100 | #42 | Exceptional $117,912 |
| Bulgarians | 100.0 /100 | #43 | Exceptional $117,818 |
| Cambodians | 100.0 /100 | #44 | Exceptional $117,780 |
| Immigrants | Greece | 99.9 /100 | #45 | Exceptional $117,344 |
| Immigrants | Russia | 99.9 /100 | #46 | Exceptional $116,942 |
| Immigrants | Austria | 99.9 /100 | #47 | Exceptional $116,830 |
| Immigrants | South Africa | 99.9 /100 | #48 | Exceptional $116,286 |
| Chinese | 99.9 /100 | #49 | Exceptional $116,188 |
| Immigrants | Czechoslovakia | 99.9 /100 | #50 | Exceptional $116,165 |
| Immigrants | Malaysia | 99.9 /100 | #51 | Exceptional $115,880 |
Demographics Similar to Paraguayans by Median Family Income
In terms of median family income, the demographic groups most similar to Paraguayans are Egyptian ($114,119, a difference of 0.090%), Immigrants from Spain ($113,815, a difference of 0.18%), Immigrants from Scotland ($114,392, a difference of 0.33%), Immigrants from Pakistan ($114,406, a difference of 0.34%), and Mongolian ($114,553, a difference of 0.47%).
| Demographics | Rating | Rank | Median Family Income |
| Immigrants | Netherlands | 99.8 /100 | #59 | Exceptional $114,987 |
| Immigrants | Latvia | 99.8 /100 | #60 | Exceptional $114,826 |
| Immigrants | Belarus | 99.8 /100 | #61 | Exceptional $114,586 |
| Mongolians | 99.8 /100 | #62 | Exceptional $114,553 |
| Immigrants | Pakistan | 99.8 /100 | #63 | Exceptional $114,406 |
| Immigrants | Scotland | 99.7 /100 | #64 | Exceptional $114,392 |
| Egyptians | 99.7 /100 | #65 | Exceptional $114,119 |
| Paraguayans | 99.7 /100 | #66 | Exceptional $114,016 |
| Immigrants | Spain | 99.7 /100 | #67 | Exceptional $113,815 |
| Immigrants | Serbia | 99.6 /100 | #68 | Exceptional $113,463 |
| Immigrants | Bulgaria | 99.6 /100 | #69 | Exceptional $113,461 |
| Immigrants | Romania | 99.6 /100 | #70 | Exceptional $113,434 |
| South Africans | 99.5 /100 | #71 | Exceptional $113,229 |
| Afghans | 99.5 /100 | #72 | Exceptional $112,971 |
| Laotians | 99.5 /100 | #73 | Exceptional $112,859 |