Cambodian vs Immigrants from Eastern Africa Median Family Income
COMPARE
Cambodian
Immigrants from Eastern Africa
Median Family Income
Median Family Income Comparison
Cambodians
Immigrants from Eastern Africa
$117,780
MEDIAN FAMILY INCOME
100.0/ 100
METRIC RATING
44th/ 347
METRIC RANK
$102,451
MEDIAN FAMILY INCOME
47.1/ 100
METRIC RATING
175th/ 347
METRIC RANK
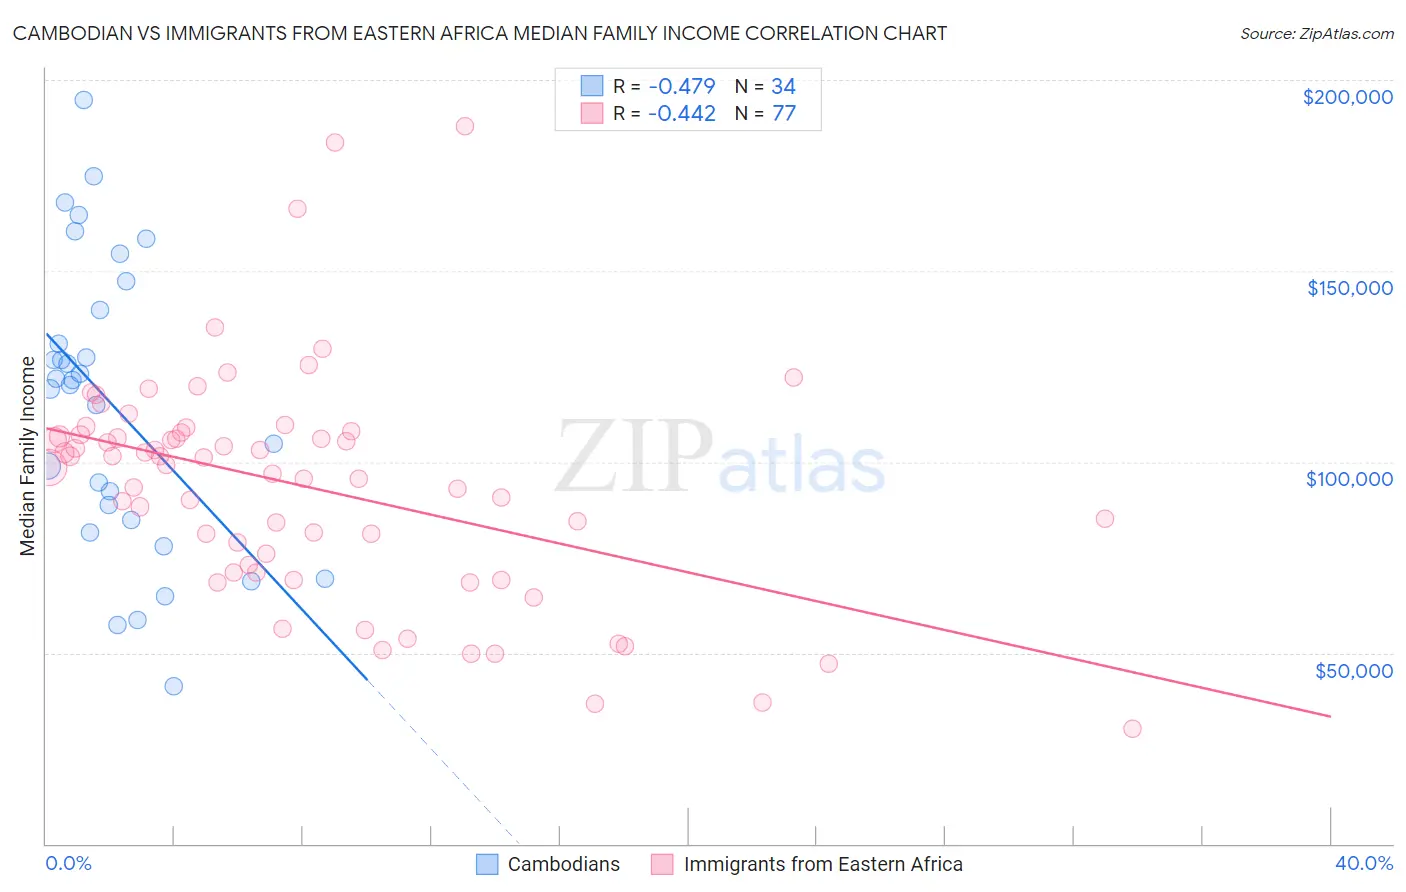
Cambodian vs Immigrants from Eastern Africa Median Family Income Correlation Chart
The statistical analysis conducted on geographies consisting of 102,461,045 people shows a moderate negative correlation between the proportion of Cambodians and median family income in the United States with a correlation coefficient (R) of -0.479 and weighted average of $117,780. Similarly, the statistical analysis conducted on geographies consisting of 354,805,172 people shows a moderate negative correlation between the proportion of Immigrants from Eastern Africa and median family income in the United States with a correlation coefficient (R) of -0.442 and weighted average of $102,451, a difference of 15.0%.
Median Family Income Correlation Summary
| Measurement | Cambodian | Immigrants from Eastern Africa |
| Minimum | $41,250 | $29,978 |
| Maximum | $194,752 | $188,047 |
| Range | $153,502 | $158,069 |
| Mean | $114,811 | $93,590 |
| Median | $120,749 | $99,122 |
| Interquartile 25% (IQ1) | $84,853 | $71,998 |
| Interquartile 75% (IQ3) | $139,722 | $107,333 |
| Interquartile Range (IQR) | $54,869 | $35,335 |
| Standard Deviation (Sample) | $37,903 | $29,714 |
| Standard Deviation (Population) | $37,342 | $29,520 |
Similar Demographics by Median Family Income
Demographics Similar to Cambodians by Median Family Income
In terms of median family income, the demographic groups most similar to Cambodians are Bulgarian ($117,818, a difference of 0.030%), Immigrants from Bolivia ($117,912, a difference of 0.11%), Estonian ($118,013, a difference of 0.20%), Immigrants from Lithuania ($118,053, a difference of 0.23%), and Immigrants from Greece ($117,344, a difference of 0.37%).
| Demographics | Rating | Rank | Median Family Income |
| Australians | 100.0 /100 | #37 | Exceptional $118,440 |
| Immigrants | Turkey | 100.0 /100 | #38 | Exceptional $118,325 |
| Immigrants | Asia | 100.0 /100 | #39 | Exceptional $118,291 |
| Immigrants | Lithuania | 100.0 /100 | #40 | Exceptional $118,053 |
| Estonians | 100.0 /100 | #41 | Exceptional $118,013 |
| Immigrants | Bolivia | 100.0 /100 | #42 | Exceptional $117,912 |
| Bulgarians | 100.0 /100 | #43 | Exceptional $117,818 |
| Cambodians | 100.0 /100 | #44 | Exceptional $117,780 |
| Immigrants | Greece | 99.9 /100 | #45 | Exceptional $117,344 |
| Immigrants | Russia | 99.9 /100 | #46 | Exceptional $116,942 |
| Immigrants | Austria | 99.9 /100 | #47 | Exceptional $116,830 |
| Immigrants | South Africa | 99.9 /100 | #48 | Exceptional $116,286 |
| Chinese | 99.9 /100 | #49 | Exceptional $116,188 |
| Immigrants | Czechoslovakia | 99.9 /100 | #50 | Exceptional $116,165 |
| Immigrants | Malaysia | 99.9 /100 | #51 | Exceptional $115,880 |
Demographics Similar to Immigrants from Eastern Africa by Median Family Income
In terms of median family income, the demographic groups most similar to Immigrants from Eastern Africa are French ($102,368, a difference of 0.080%), German ($102,254, a difference of 0.19%), Finnish ($102,676, a difference of 0.22%), Welsh ($102,151, a difference of 0.29%), and Belgian ($102,788, a difference of 0.33%).
| Demographics | Rating | Rank | Median Family Income |
| Immigrants | Peru | 60.8 /100 | #168 | Good $103,534 |
| Czechoslovakians | 57.6 /100 | #169 | Average $103,273 |
| Immigrants | Uzbekistan | 56.6 /100 | #170 | Average $103,197 |
| Alsatians | 54.3 /100 | #171 | Average $103,010 |
| Immigrants | Eritrea | 51.9 /100 | #172 | Average $102,823 |
| Belgians | 51.4 /100 | #173 | Average $102,788 |
| Finns | 50.0 /100 | #174 | Average $102,676 |
| Immigrants | Eastern Africa | 47.1 /100 | #175 | Average $102,451 |
| French | 46.1 /100 | #176 | Average $102,368 |
| Germans | 44.6 /100 | #177 | Average $102,254 |
| Welsh | 43.3 /100 | #178 | Average $102,151 |
| South Americans | 39.7 /100 | #179 | Fair $101,856 |
| French Canadians | 37.0 /100 | #180 | Fair $101,634 |
| Spaniards | 36.8 /100 | #181 | Fair $101,617 |
| Tsimshian | 35.9 /100 | #182 | Fair $101,543 |