Cambodian vs Hispanic or Latino Median Family Income
COMPARE
Cambodian
Hispanic or Latino
Median Family Income
Median Family Income Comparison
Cambodians
Hispanics or Latinos
$117,780
MEDIAN FAMILY INCOME
100.0/ 100
METRIC RATING
44th/ 347
METRIC RANK
$85,647
MEDIAN FAMILY INCOME
0.0/ 100
METRIC RATING
303rd/ 347
METRIC RANK
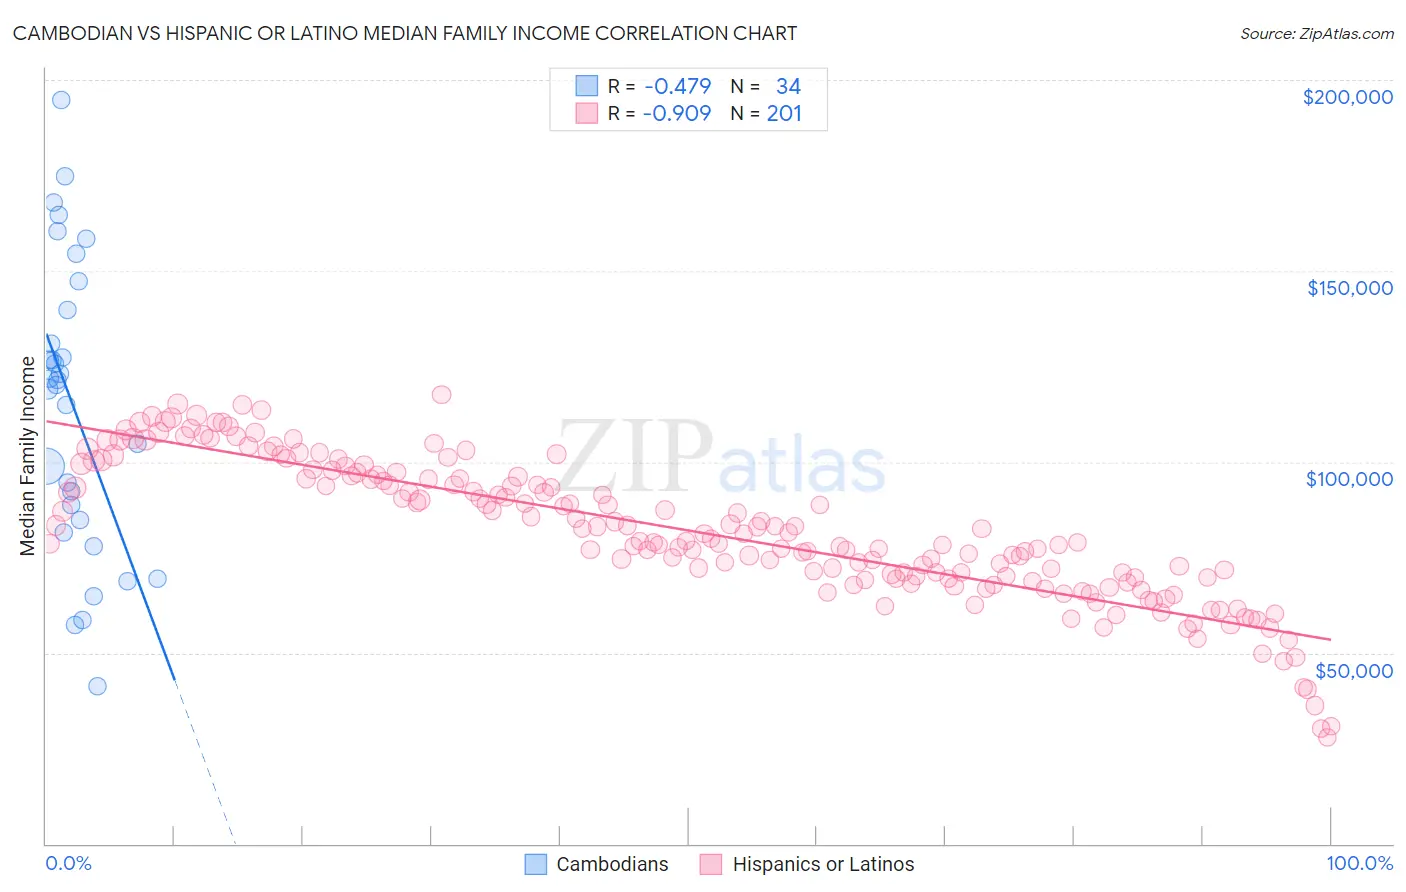
Cambodian vs Hispanic or Latino Median Family Income Correlation Chart
The statistical analysis conducted on geographies consisting of 102,461,045 people shows a moderate negative correlation between the proportion of Cambodians and median family income in the United States with a correlation coefficient (R) of -0.479 and weighted average of $117,780. Similarly, the statistical analysis conducted on geographies consisting of 576,861,643 people shows a near-perfect negative correlation between the proportion of Hispanics or Latinos and median family income in the United States with a correlation coefficient (R) of -0.909 and weighted average of $85,647, a difference of 37.5%.
Median Family Income Correlation Summary
| Measurement | Cambodian | Hispanic or Latino |
| Minimum | $41,250 | $27,753 |
| Maximum | $194,752 | $117,566 |
| Range | $153,502 | $89,813 |
| Mean | $114,811 | $81,882 |
| Median | $120,749 | $79,837 |
| Interquartile 25% (IQ1) | $84,853 | $69,539 |
| Interquartile 75% (IQ3) | $139,722 | $96,180 |
| Interquartile Range (IQR) | $54,869 | $26,641 |
| Standard Deviation (Sample) | $37,903 | $18,312 |
| Standard Deviation (Population) | $37,342 | $18,267 |
Similar Demographics by Median Family Income
Demographics Similar to Cambodians by Median Family Income
In terms of median family income, the demographic groups most similar to Cambodians are Bulgarian ($117,818, a difference of 0.030%), Immigrants from Bolivia ($117,912, a difference of 0.11%), Estonian ($118,013, a difference of 0.20%), Immigrants from Lithuania ($118,053, a difference of 0.23%), and Immigrants from Greece ($117,344, a difference of 0.37%).
| Demographics | Rating | Rank | Median Family Income |
| Australians | 100.0 /100 | #37 | Exceptional $118,440 |
| Immigrants | Turkey | 100.0 /100 | #38 | Exceptional $118,325 |
| Immigrants | Asia | 100.0 /100 | #39 | Exceptional $118,291 |
| Immigrants | Lithuania | 100.0 /100 | #40 | Exceptional $118,053 |
| Estonians | 100.0 /100 | #41 | Exceptional $118,013 |
| Immigrants | Bolivia | 100.0 /100 | #42 | Exceptional $117,912 |
| Bulgarians | 100.0 /100 | #43 | Exceptional $117,818 |
| Cambodians | 100.0 /100 | #44 | Exceptional $117,780 |
| Immigrants | Greece | 99.9 /100 | #45 | Exceptional $117,344 |
| Immigrants | Russia | 99.9 /100 | #46 | Exceptional $116,942 |
| Immigrants | Austria | 99.9 /100 | #47 | Exceptional $116,830 |
| Immigrants | South Africa | 99.9 /100 | #48 | Exceptional $116,286 |
| Chinese | 99.9 /100 | #49 | Exceptional $116,188 |
| Immigrants | Czechoslovakia | 99.9 /100 | #50 | Exceptional $116,165 |
| Immigrants | Malaysia | 99.9 /100 | #51 | Exceptional $115,880 |
Demographics Similar to Hispanics or Latinos by Median Family Income
In terms of median family income, the demographic groups most similar to Hispanics or Latinos are Mexican ($85,618, a difference of 0.030%), Spanish American Indian ($85,728, a difference of 0.090%), Colville ($85,792, a difference of 0.17%), Paiute ($85,414, a difference of 0.27%), and Immigrants from Dominica ($85,411, a difference of 0.28%).
| Demographics | Rating | Rank | Median Family Income |
| Immigrants | Guatemala | 0.0 /100 | #296 | Tragic $87,191 |
| Cajuns | 0.0 /100 | #297 | Tragic $87,157 |
| Immigrants | Latin America | 0.0 /100 | #298 | Tragic $86,989 |
| Chippewa | 0.0 /100 | #299 | Tragic $86,852 |
| Ottawa | 0.0 /100 | #300 | Tragic $86,380 |
| Colville | 0.0 /100 | #301 | Tragic $85,792 |
| Spanish American Indians | 0.0 /100 | #302 | Tragic $85,728 |
| Hispanics or Latinos | 0.0 /100 | #303 | Tragic $85,647 |
| Mexicans | 0.0 /100 | #304 | Tragic $85,618 |
| Paiute | 0.0 /100 | #305 | Tragic $85,414 |
| Immigrants | Dominica | 0.0 /100 | #306 | Tragic $85,411 |
| Chickasaw | 0.0 /100 | #307 | Tragic $85,356 |
| U.S. Virgin Islanders | 0.0 /100 | #308 | Tragic $85,294 |
| Haitians | 0.0 /100 | #309 | Tragic $85,218 |
| Immigrants | Central America | 0.0 /100 | #310 | Tragic $85,050 |