Cambodian vs Immigrants from Canada Median Family Income
COMPARE
Cambodian
Immigrants from Canada
Median Family Income
Median Family Income Comparison
Cambodians
Immigrants from Canada
$117,780
MEDIAN FAMILY INCOME
100.0/ 100
METRIC RATING
44th/ 347
METRIC RANK
$112,374
MEDIAN FAMILY INCOME
99.3/ 100
METRIC RATING
78th/ 347
METRIC RANK
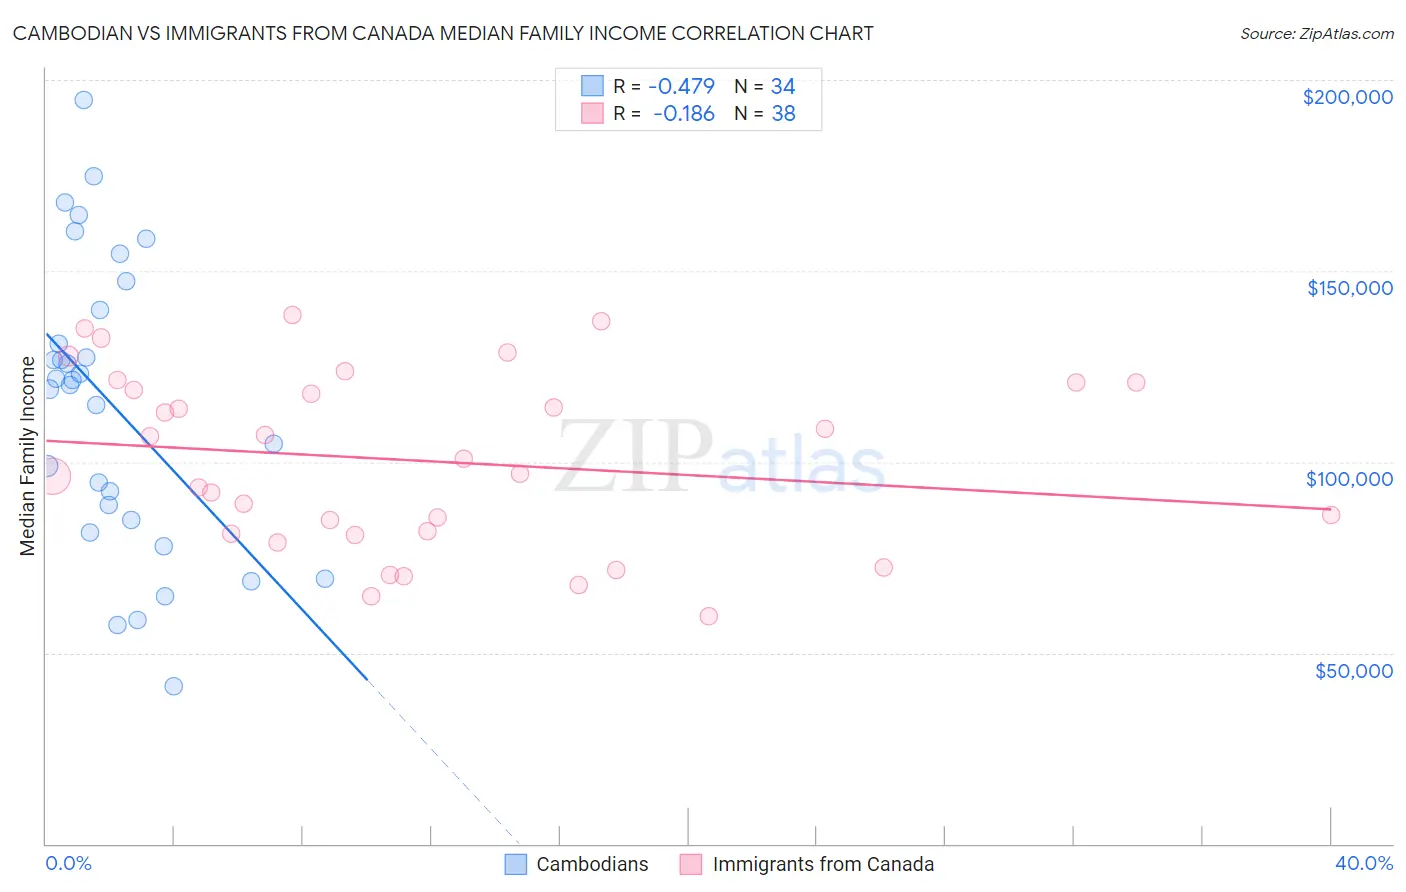
Cambodian vs Immigrants from Canada Median Family Income Correlation Chart
The statistical analysis conducted on geographies consisting of 102,461,045 people shows a moderate negative correlation between the proportion of Cambodians and median family income in the United States with a correlation coefficient (R) of -0.479 and weighted average of $117,780. Similarly, the statistical analysis conducted on geographies consisting of 458,941,757 people shows a poor negative correlation between the proportion of Immigrants from Canada and median family income in the United States with a correlation coefficient (R) of -0.186 and weighted average of $112,374, a difference of 4.8%.
Median Family Income Correlation Summary
| Measurement | Cambodian | Immigrants from Canada |
| Minimum | $41,250 | $59,444 |
| Maximum | $194,752 | $138,302 |
| Range | $153,502 | $78,858 |
| Mean | $114,811 | $100,298 |
| Median | $120,749 | $98,848 |
| Interquartile 25% (IQ1) | $84,853 | $81,159 |
| Interquartile 75% (IQ3) | $139,722 | $120,729 |
| Interquartile Range (IQR) | $54,869 | $39,570 |
| Standard Deviation (Sample) | $37,903 | $23,025 |
| Standard Deviation (Population) | $37,342 | $22,720 |
Similar Demographics by Median Family Income
Demographics Similar to Cambodians by Median Family Income
In terms of median family income, the demographic groups most similar to Cambodians are Bulgarian ($117,818, a difference of 0.030%), Immigrants from Bolivia ($117,912, a difference of 0.11%), Estonian ($118,013, a difference of 0.20%), Immigrants from Lithuania ($118,053, a difference of 0.23%), and Immigrants from Greece ($117,344, a difference of 0.37%).
| Demographics | Rating | Rank | Median Family Income |
| Australians | 100.0 /100 | #37 | Exceptional $118,440 |
| Immigrants | Turkey | 100.0 /100 | #38 | Exceptional $118,325 |
| Immigrants | Asia | 100.0 /100 | #39 | Exceptional $118,291 |
| Immigrants | Lithuania | 100.0 /100 | #40 | Exceptional $118,053 |
| Estonians | 100.0 /100 | #41 | Exceptional $118,013 |
| Immigrants | Bolivia | 100.0 /100 | #42 | Exceptional $117,912 |
| Bulgarians | 100.0 /100 | #43 | Exceptional $117,818 |
| Cambodians | 100.0 /100 | #44 | Exceptional $117,780 |
| Immigrants | Greece | 99.9 /100 | #45 | Exceptional $117,344 |
| Immigrants | Russia | 99.9 /100 | #46 | Exceptional $116,942 |
| Immigrants | Austria | 99.9 /100 | #47 | Exceptional $116,830 |
| Immigrants | South Africa | 99.9 /100 | #48 | Exceptional $116,286 |
| Chinese | 99.9 /100 | #49 | Exceptional $116,188 |
| Immigrants | Czechoslovakia | 99.9 /100 | #50 | Exceptional $116,165 |
| Immigrants | Malaysia | 99.9 /100 | #51 | Exceptional $115,880 |
Demographics Similar to Immigrants from Canada by Median Family Income
In terms of median family income, the demographic groups most similar to Immigrants from Canada are Italian ($112,372, a difference of 0.0%), Immigrants from Croatia ($112,323, a difference of 0.050%), Immigrants from Eastern Europe ($112,527, a difference of 0.14%), Immigrants from North America ($112,151, a difference of 0.20%), and Argentinean ($112,665, a difference of 0.26%).
| Demographics | Rating | Rank | Median Family Income |
| South Africans | 99.5 /100 | #71 | Exceptional $113,229 |
| Afghans | 99.5 /100 | #72 | Exceptional $112,971 |
| Laotians | 99.5 /100 | #73 | Exceptional $112,859 |
| Immigrants | Italy | 99.4 /100 | #74 | Exceptional $112,848 |
| Immigrants | Western Europe | 99.4 /100 | #75 | Exceptional $112,688 |
| Argentineans | 99.4 /100 | #76 | Exceptional $112,665 |
| Immigrants | Eastern Europe | 99.4 /100 | #77 | Exceptional $112,527 |
| Immigrants | Canada | 99.3 /100 | #78 | Exceptional $112,374 |
| Italians | 99.3 /100 | #79 | Exceptional $112,372 |
| Immigrants | Croatia | 99.3 /100 | #80 | Exceptional $112,323 |
| Immigrants | North America | 99.2 /100 | #81 | Exceptional $112,151 |
| Immigrants | England | 99.2 /100 | #82 | Exceptional $112,038 |
| Immigrants | Egypt | 99.0 /100 | #83 | Exceptional $111,689 |
| Immigrants | Hungary | 98.8 /100 | #84 | Exceptional $111,378 |
| Croatians | 98.8 /100 | #85 | Exceptional $111,370 |