Cambodian vs Immigrants from Germany Median Female Earnings
COMPARE
Cambodian
Immigrants from Germany
Median Female Earnings
Median Female Earnings Comparison
Cambodians
Immigrants from Germany
$45,014
MEDIAN FEMALE EARNINGS
100.0/ 100
METRIC RATING
21st/ 347
METRIC RANK
$39,603
MEDIAN FEMALE EARNINGS
45.1/ 100
METRIC RATING
179th/ 347
METRIC RANK
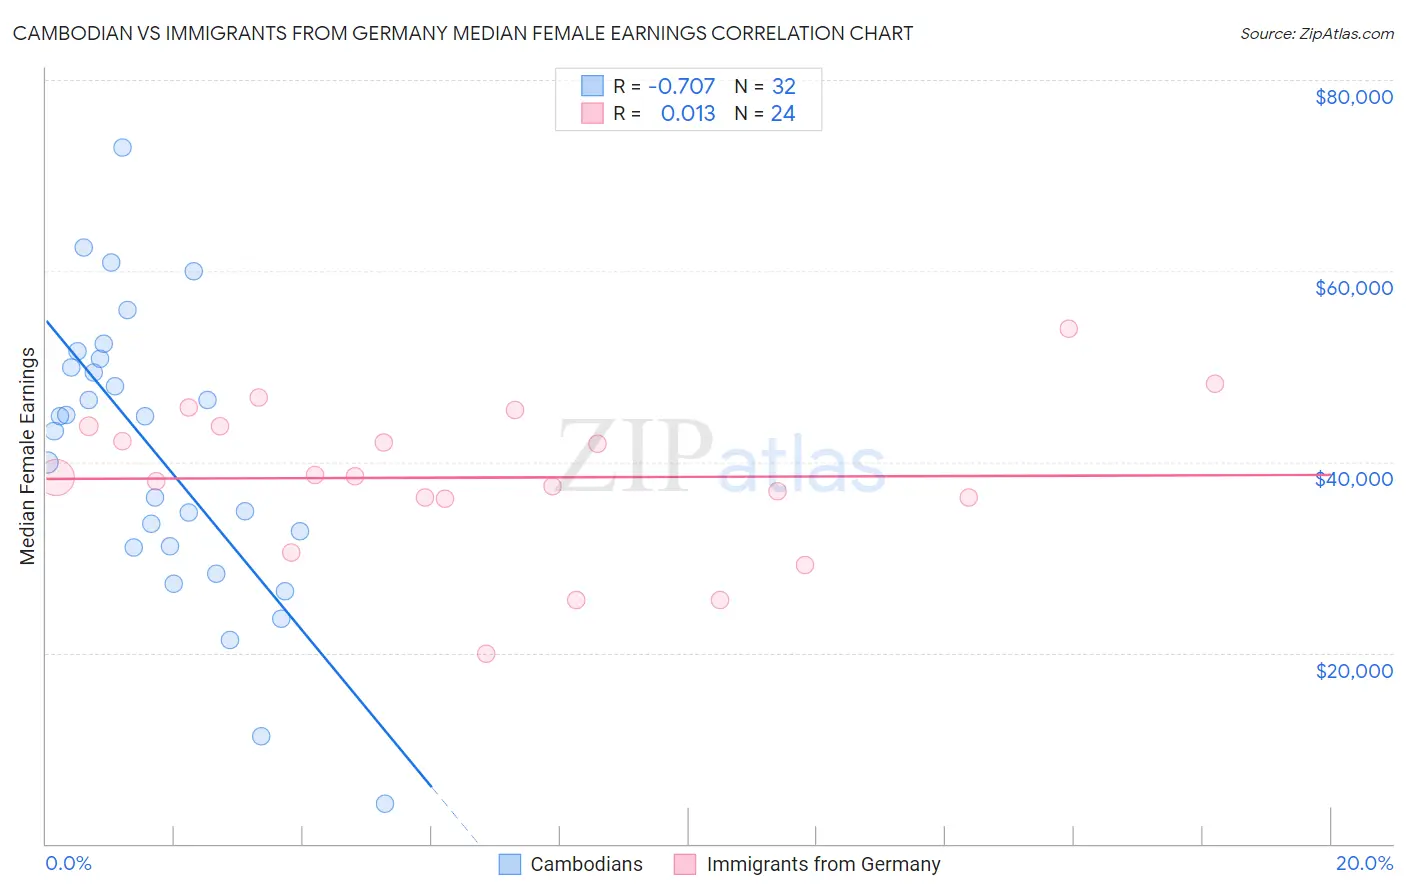
Cambodian vs Immigrants from Germany Median Female Earnings Correlation Chart
The statistical analysis conducted on geographies consisting of 102,513,966 people shows a strong negative correlation between the proportion of Cambodians and median female earnings in the United States with a correlation coefficient (R) of -0.707 and weighted average of $45,014. Similarly, the statistical analysis conducted on geographies consisting of 463,482,548 people shows no correlation between the proportion of Immigrants from Germany and median female earnings in the United States with a correlation coefficient (R) of 0.013 and weighted average of $39,603, a difference of 13.7%.
Median Female Earnings Correlation Summary
| Measurement | Cambodian | Immigrants from Germany |
| Minimum | $4,132 | $19,917 |
| Maximum | $72,888 | $53,929 |
| Range | $68,756 | $34,012 |
| Mean | $40,669 | $38,361 |
| Median | $43,973 | $38,420 |
| Interquartile 25% (IQ1) | $31,093 | $36,204 |
| Interquartile 75% (IQ3) | $50,357 | $43,786 |
| Interquartile Range (IQR) | $19,265 | $7,582 |
| Standard Deviation (Sample) | $15,041 | $7,917 |
| Standard Deviation (Population) | $14,804 | $7,751 |
Similar Demographics by Median Female Earnings
Demographics Similar to Cambodians by Median Female Earnings
In terms of median female earnings, the demographic groups most similar to Cambodians are Immigrants from Greece ($44,976, a difference of 0.080%), Burmese ($44,911, a difference of 0.23%), Immigrants from Korea ($44,847, a difference of 0.37%), Immigrants from Sweden ($44,774, a difference of 0.54%), and Immigrants from Belarus ($44,757, a difference of 0.57%).
| Demographics | Rating | Rank | Median Female Earnings |
| Soviet Union | 100.0 /100 | #14 | Exceptional $46,556 |
| Immigrants | Eastern Asia | 100.0 /100 | #15 | Exceptional $46,502 |
| Indians (Asian) | 100.0 /100 | #16 | Exceptional $46,481 |
| Immigrants | South Central Asia | 100.0 /100 | #17 | Exceptional $46,324 |
| Cypriots | 100.0 /100 | #18 | Exceptional $45,570 |
| Eastern Europeans | 100.0 /100 | #19 | Exceptional $45,385 |
| Immigrants | Japan | 100.0 /100 | #20 | Exceptional $45,323 |
| Cambodians | 100.0 /100 | #21 | Exceptional $45,014 |
| Immigrants | Greece | 100.0 /100 | #22 | Exceptional $44,976 |
| Burmese | 100.0 /100 | #23 | Exceptional $44,911 |
| Immigrants | Korea | 100.0 /100 | #24 | Exceptional $44,847 |
| Immigrants | Sweden | 100.0 /100 | #25 | Exceptional $44,774 |
| Immigrants | Belarus | 100.0 /100 | #26 | Exceptional $44,757 |
| Turks | 100.0 /100 | #27 | Exceptional $44,695 |
| Immigrants | Russia | 100.0 /100 | #28 | Exceptional $44,680 |
Demographics Similar to Immigrants from Germany by Median Female Earnings
In terms of median female earnings, the demographic groups most similar to Immigrants from Germany are Slavic ($39,613, a difference of 0.030%), Costa Rican ($39,622, a difference of 0.050%), Immigrants from South America ($39,643, a difference of 0.10%), Nigerian ($39,641, a difference of 0.10%), and Immigrants from Kenya ($39,535, a difference of 0.17%).
| Demographics | Rating | Rank | Median Female Earnings |
| British | 53.8 /100 | #172 | Average $39,772 |
| Canadians | 51.4 /100 | #173 | Average $39,724 |
| South Americans | 50.0 /100 | #174 | Average $39,698 |
| Immigrants | South America | 47.2 /100 | #175 | Average $39,643 |
| Nigerians | 47.0 /100 | #176 | Average $39,641 |
| Costa Ricans | 46.1 /100 | #177 | Average $39,622 |
| Slavs | 45.6 /100 | #178 | Average $39,613 |
| Immigrants | Germany | 45.1 /100 | #179 | Average $39,603 |
| Immigrants | Kenya | 41.6 /100 | #180 | Average $39,535 |
| Tsimshian | 41.4 /100 | #181 | Average $39,530 |
| Tlingit-Haida | 40.5 /100 | #182 | Average $39,513 |
| Hungarians | 40.3 /100 | #183 | Average $39,510 |
| Europeans | 37.7 /100 | #184 | Fair $39,457 |
| Immigrants | West Indies | 36.9 /100 | #185 | Fair $39,441 |
| Colombians | 36.9 /100 | #186 | Fair $39,439 |