Cambodian vs Immigrants from Hong Kong Births to Unmarried Women
COMPARE
Cambodian
Immigrants from Hong Kong
Births to Unmarried Women
Births to Unmarried Women Comparison
Cambodians
Immigrants from Hong Kong
26.7%
BIRTHS TO UNMARRIED WOMEN
99.9/ 100
METRIC RATING
25th/ 347
METRIC RANK
23.6%
BIRTHS TO UNMARRIED WOMEN
100.0/ 100
METRIC RATING
5th/ 347
METRIC RANK
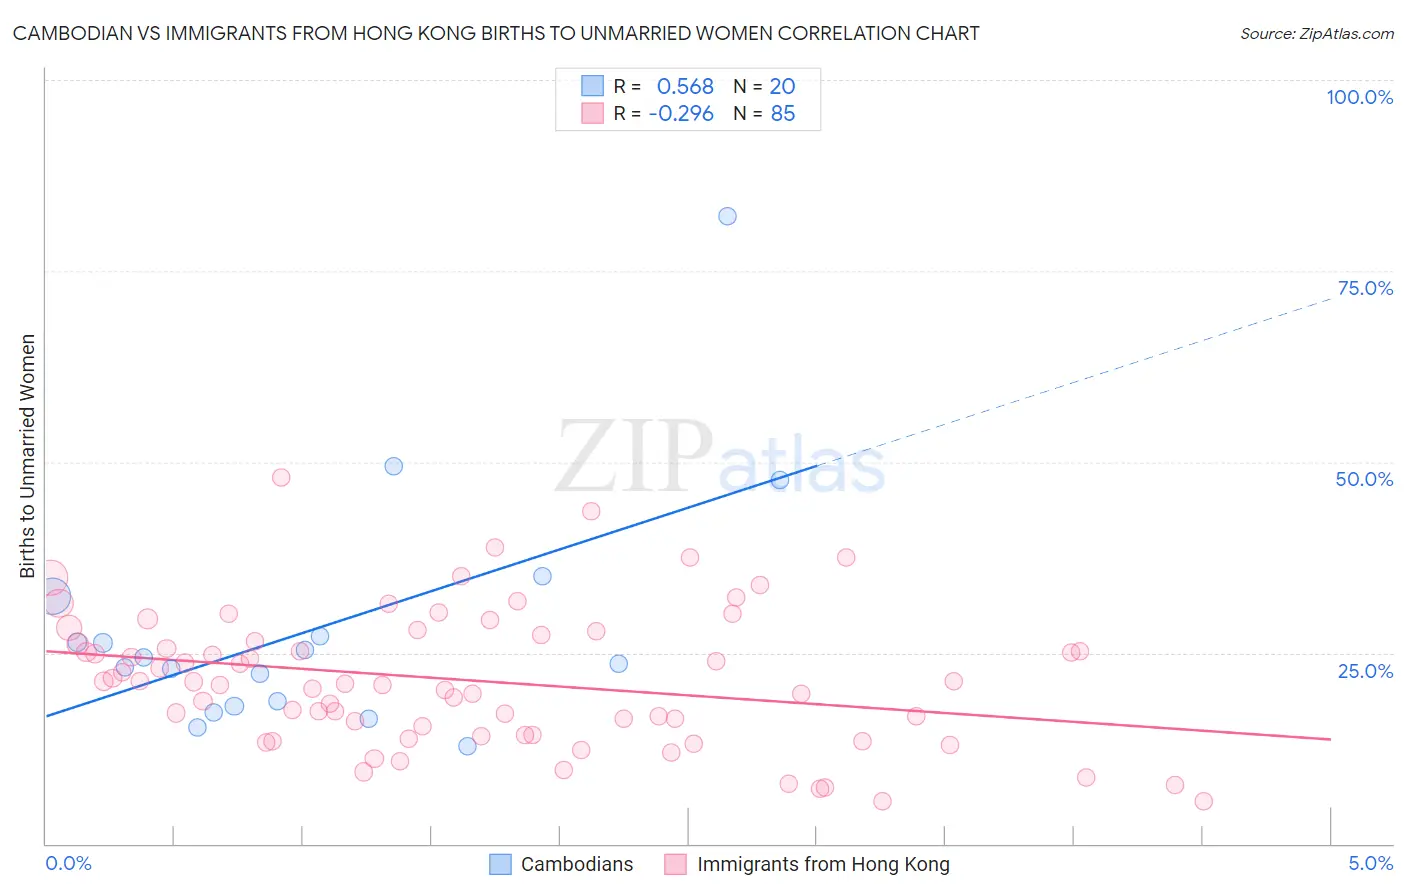
Cambodian vs Immigrants from Hong Kong Births to Unmarried Women Correlation Chart
The statistical analysis conducted on geographies consisting of 99,884,010 people shows a substantial positive correlation between the proportion of Cambodians and percentage of births to unmarried women in the United States with a correlation coefficient (R) of 0.568 and weighted average of 26.7%. Similarly, the statistical analysis conducted on geographies consisting of 239,354,992 people shows a weak negative correlation between the proportion of Immigrants from Hong Kong and percentage of births to unmarried women in the United States with a correlation coefficient (R) of -0.296 and weighted average of 23.6%, a difference of 13.2%.
Births to Unmarried Women Correlation Summary
| Measurement | Cambodian | Immigrants from Hong Kong |
| Minimum | 12.7% | 5.6% |
| Maximum | 82.1% | 48.0% |
| Range | 69.4% | 42.4% |
| Mean | 28.3% | 21.4% |
| Median | 23.9% | 21.0% |
| Interquartile 25% (IQ1) | 18.4% | 14.3% |
| Interquartile 75% (IQ3) | 29.7% | 26.9% |
| Interquartile Range (IQR) | 11.3% | 12.6% |
| Standard Deviation (Sample) | 15.9% | 8.9% |
| Standard Deviation (Population) | 15.5% | 8.8% |
Demographics Similar to Cambodians and Immigrants from Hong Kong by Births to Unmarried Women
In terms of births to unmarried women, the demographic groups most similar to Cambodians are Immigrants from Australia (26.6%, a difference of 0.21%), Immigrants from Japan (26.4%, a difference of 1.0%), Burmese (26.4%, a difference of 1.2%), Soviet Union (26.3%, a difference of 1.4%), and Immigrants from Korea (26.3%, a difference of 1.5%). Similarly, the demographic groups most similar to Immigrants from Hong Kong are Immigrants from Iran (24.0%, a difference of 1.6%), Thai (24.0%, a difference of 1.9%), Immigrants from China (24.7%, a difference of 4.7%), Immigrants from South Central Asia (24.7%, a difference of 4.7%), and Immigrants from Eastern Asia (25.0%, a difference of 6.2%).
| Demographics | Rating | Rank | Births to Unmarried Women |
| Immigrants | Hong Kong | 100.0 /100 | #5 | Exceptional 23.6% |
| Immigrants | Iran | 100.0 /100 | #6 | Exceptional 24.0% |
| Thais | 100.0 /100 | #7 | Exceptional 24.0% |
| Immigrants | China | 100.0 /100 | #8 | Exceptional 24.7% |
| Immigrants | South Central Asia | 100.0 /100 | #9 | Exceptional 24.7% |
| Immigrants | Eastern Asia | 100.0 /100 | #10 | Exceptional 25.0% |
| Immigrants | Israel | 100.0 /100 | #11 | Exceptional 25.1% |
| Indians (Asian) | 100.0 /100 | #12 | Exceptional 25.3% |
| Iranians | 100.0 /100 | #13 | Exceptional 25.3% |
| Immigrants | Lebanon | 100.0 /100 | #14 | Exceptional 25.3% |
| Immigrants | Singapore | 100.0 /100 | #15 | Exceptional 25.6% |
| Immigrants | Belarus | 100.0 /100 | #16 | Exceptional 25.6% |
| Immigrants | Uzbekistan | 100.0 /100 | #17 | Exceptional 25.8% |
| Immigrants | Armenia | 99.9 /100 | #18 | Exceptional 26.1% |
| Armenians | 99.9 /100 | #19 | Exceptional 26.2% |
| Immigrants | Korea | 99.9 /100 | #20 | Exceptional 26.3% |
| Soviet Union | 99.9 /100 | #21 | Exceptional 26.3% |
| Burmese | 99.9 /100 | #22 | Exceptional 26.4% |
| Immigrants | Japan | 99.9 /100 | #23 | Exceptional 26.4% |
| Immigrants | Australia | 99.9 /100 | #24 | Exceptional 26.6% |
| Cambodians | 99.9 /100 | #25 | Exceptional 26.7% |