Cambodian vs Immigrants from Burma/Myanmar Median Female Earnings
COMPARE
Cambodian
Immigrants from Burma/Myanmar
Median Female Earnings
Median Female Earnings Comparison
Cambodians
Immigrants from Burma/Myanmar
$45,014
MEDIAN FEMALE EARNINGS
100.0/ 100
METRIC RATING
21st/ 347
METRIC RANK
$38,028
MEDIAN FEMALE EARNINGS
3.0/ 100
METRIC RATING
242nd/ 347
METRIC RANK
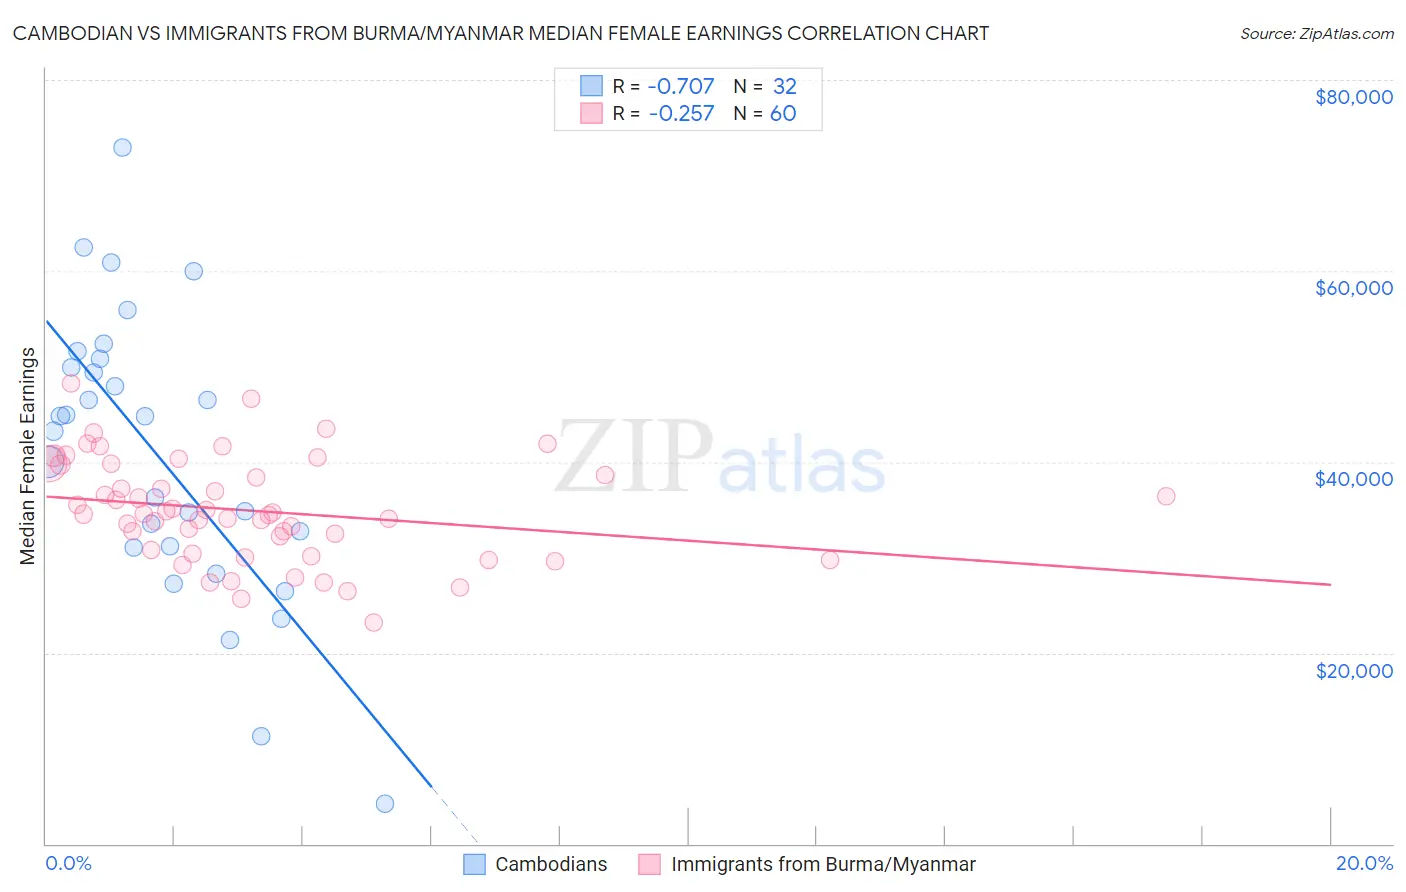
Cambodian vs Immigrants from Burma/Myanmar Median Female Earnings Correlation Chart
The statistical analysis conducted on geographies consisting of 102,513,966 people shows a strong negative correlation between the proportion of Cambodians and median female earnings in the United States with a correlation coefficient (R) of -0.707 and weighted average of $45,014. Similarly, the statistical analysis conducted on geographies consisting of 172,347,432 people shows a weak negative correlation between the proportion of Immigrants from Burma/Myanmar and median female earnings in the United States with a correlation coefficient (R) of -0.257 and weighted average of $38,028, a difference of 18.4%.
Median Female Earnings Correlation Summary
| Measurement | Cambodian | Immigrants from Burma/Myanmar |
| Minimum | $4,132 | $23,125 |
| Maximum | $72,888 | $48,239 |
| Range | $68,756 | $25,114 |
| Mean | $40,669 | $34,892 |
| Median | $43,973 | $34,545 |
| Interquartile 25% (IQ1) | $31,093 | $30,606 |
| Interquartile 75% (IQ3) | $50,357 | $39,132 |
| Interquartile Range (IQR) | $19,265 | $8,525 |
| Standard Deviation (Sample) | $15,041 | $5,366 |
| Standard Deviation (Population) | $14,804 | $5,321 |
Similar Demographics by Median Female Earnings
Demographics Similar to Cambodians by Median Female Earnings
In terms of median female earnings, the demographic groups most similar to Cambodians are Immigrants from Greece ($44,976, a difference of 0.080%), Burmese ($44,911, a difference of 0.23%), Immigrants from Korea ($44,847, a difference of 0.37%), Immigrants from Sweden ($44,774, a difference of 0.54%), and Immigrants from Belarus ($44,757, a difference of 0.57%).
| Demographics | Rating | Rank | Median Female Earnings |
| Soviet Union | 100.0 /100 | #14 | Exceptional $46,556 |
| Immigrants | Eastern Asia | 100.0 /100 | #15 | Exceptional $46,502 |
| Indians (Asian) | 100.0 /100 | #16 | Exceptional $46,481 |
| Immigrants | South Central Asia | 100.0 /100 | #17 | Exceptional $46,324 |
| Cypriots | 100.0 /100 | #18 | Exceptional $45,570 |
| Eastern Europeans | 100.0 /100 | #19 | Exceptional $45,385 |
| Immigrants | Japan | 100.0 /100 | #20 | Exceptional $45,323 |
| Cambodians | 100.0 /100 | #21 | Exceptional $45,014 |
| Immigrants | Greece | 100.0 /100 | #22 | Exceptional $44,976 |
| Burmese | 100.0 /100 | #23 | Exceptional $44,911 |
| Immigrants | Korea | 100.0 /100 | #24 | Exceptional $44,847 |
| Immigrants | Sweden | 100.0 /100 | #25 | Exceptional $44,774 |
| Immigrants | Belarus | 100.0 /100 | #26 | Exceptional $44,757 |
| Turks | 100.0 /100 | #27 | Exceptional $44,695 |
| Immigrants | Russia | 100.0 /100 | #28 | Exceptional $44,680 |
Demographics Similar to Immigrants from Burma/Myanmar by Median Female Earnings
In terms of median female earnings, the demographic groups most similar to Immigrants from Burma/Myanmar are German ($37,986, a difference of 0.11%), Immigrants from Liberia ($37,970, a difference of 0.15%), Immigrants from Middle Africa ($37,965, a difference of 0.17%), Delaware ($37,964, a difference of 0.17%), and Spanish ($38,098, a difference of 0.18%).
| Demographics | Rating | Rank | Median Female Earnings |
| Sudanese | 4.4 /100 | #235 | Tragic $38,215 |
| Liberians | 4.4 /100 | #236 | Tragic $38,215 |
| Immigrants | Cabo Verde | 4.3 /100 | #237 | Tragic $38,208 |
| Alaska Natives | 4.3 /100 | #238 | Tragic $38,202 |
| English | 4.2 /100 | #239 | Tragic $38,196 |
| Finns | 4.0 /100 | #240 | Tragic $38,173 |
| Spanish | 3.5 /100 | #241 | Tragic $38,098 |
| Immigrants | Burma/Myanmar | 3.0 /100 | #242 | Tragic $38,028 |
| Germans | 2.8 /100 | #243 | Tragic $37,986 |
| Immigrants | Liberia | 2.7 /100 | #244 | Tragic $37,970 |
| Immigrants | Middle Africa | 2.7 /100 | #245 | Tragic $37,965 |
| Delaware | 2.6 /100 | #246 | Tragic $37,964 |
| Immigrants | Somalia | 2.4 /100 | #247 | Tragic $37,914 |
| Alaskan Athabascans | 2.3 /100 | #248 | Tragic $37,905 |
| Swiss | 2.3 /100 | #249 | Tragic $37,904 |