Cambodian vs Immigrants from Australia Median Female Earnings
COMPARE
Cambodian
Immigrants from Australia
Median Female Earnings
Median Female Earnings Comparison
Cambodians
Immigrants from Australia
$45,014
MEDIAN FEMALE EARNINGS
100.0/ 100
METRIC RATING
21st/ 347
METRIC RANK
$46,573
MEDIAN FEMALE EARNINGS
100.0/ 100
METRIC RATING
13th/ 347
METRIC RANK
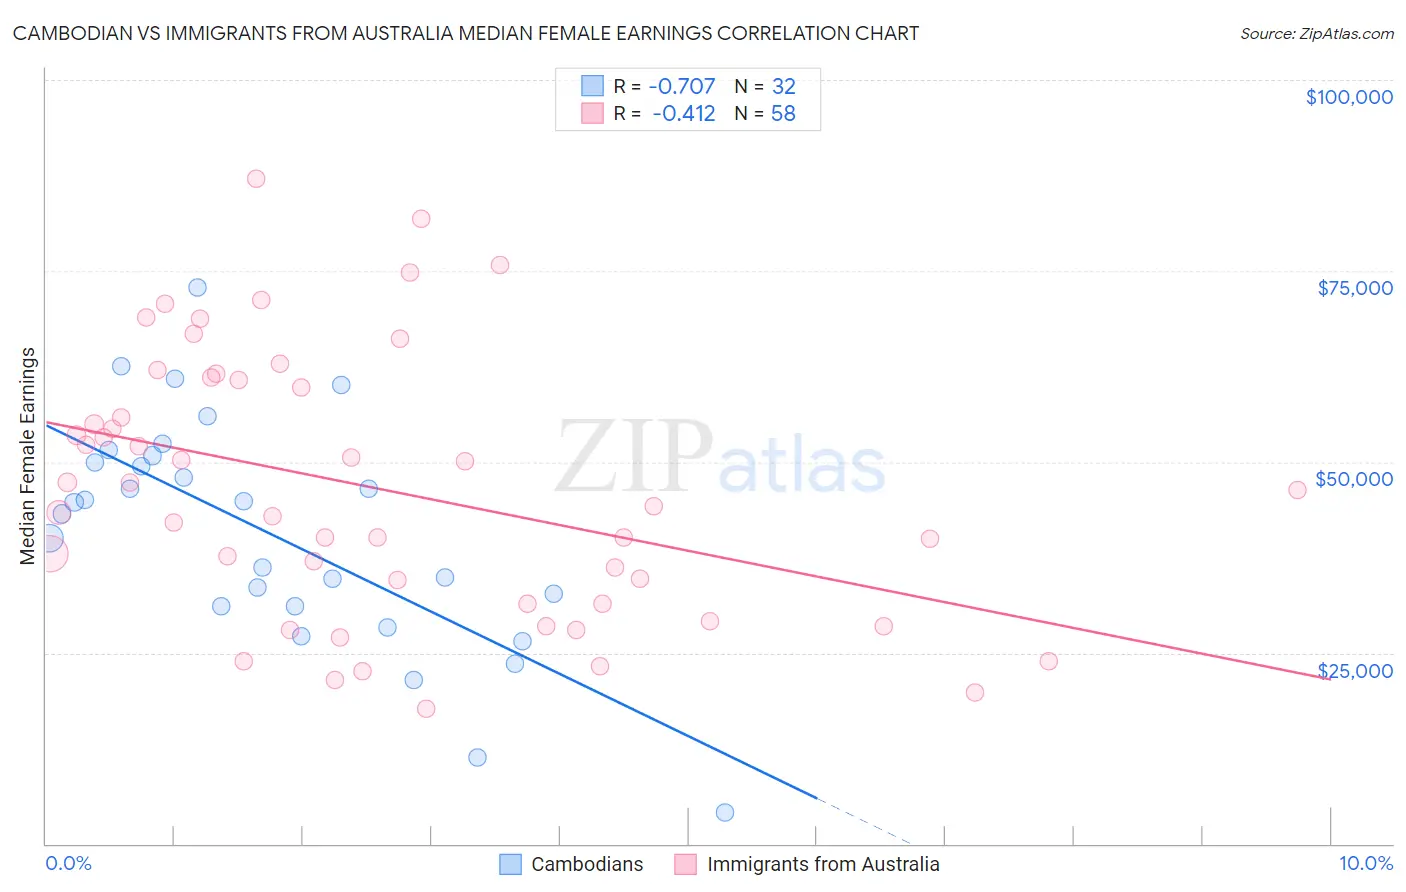
Cambodian vs Immigrants from Australia Median Female Earnings Correlation Chart
The statistical analysis conducted on geographies consisting of 102,513,966 people shows a strong negative correlation between the proportion of Cambodians and median female earnings in the United States with a correlation coefficient (R) of -0.707 and weighted average of $45,014. Similarly, the statistical analysis conducted on geographies consisting of 227,158,397 people shows a moderate negative correlation between the proportion of Immigrants from Australia and median female earnings in the United States with a correlation coefficient (R) of -0.412 and weighted average of $46,573, a difference of 3.5%.
Median Female Earnings Correlation Summary
| Measurement | Cambodian | Immigrants from Australia |
| Minimum | $4,132 | $17,627 |
| Maximum | $72,888 | $87,039 |
| Range | $68,756 | $69,412 |
| Mean | $40,669 | $46,604 |
| Median | $43,973 | $45,208 |
| Interquartile 25% (IQ1) | $31,093 | $31,477 |
| Interquartile 75% (IQ3) | $50,357 | $60,732 |
| Interquartile Range (IQR) | $19,265 | $29,255 |
| Standard Deviation (Sample) | $15,041 | $17,219 |
| Standard Deviation (Population) | $14,804 | $17,070 |
Demographics Similar to Cambodians and Immigrants from Australia by Median Female Earnings
In terms of median female earnings, the demographic groups most similar to Cambodians are Immigrants from Greece ($44,976, a difference of 0.080%), Burmese ($44,911, a difference of 0.23%), Immigrants from Korea ($44,847, a difference of 0.37%), Immigrants from Sweden ($44,774, a difference of 0.54%), and Immigrants from Belarus ($44,757, a difference of 0.57%). Similarly, the demographic groups most similar to Immigrants from Australia are Soviet Union ($46,556, a difference of 0.040%), Immigrants from Eastern Asia ($46,502, a difference of 0.15%), Indian (Asian) ($46,481, a difference of 0.20%), Immigrants from South Central Asia ($46,324, a difference of 0.54%), and Okinawan ($46,905, a difference of 0.71%).
| Demographics | Rating | Rank | Median Female Earnings |
| Thais | 100.0 /100 | #7 | Exceptional $47,577 |
| Iranians | 100.0 /100 | #8 | Exceptional $47,421 |
| Immigrants | Iran | 100.0 /100 | #9 | Exceptional $47,154 |
| Immigrants | China | 100.0 /100 | #10 | Exceptional $46,972 |
| Okinawans | 100.0 /100 | #11 | Exceptional $46,905 |
| Immigrants | Israel | 100.0 /100 | #12 | Exceptional $46,902 |
| Immigrants | Australia | 100.0 /100 | #13 | Exceptional $46,573 |
| Soviet Union | 100.0 /100 | #14 | Exceptional $46,556 |
| Immigrants | Eastern Asia | 100.0 /100 | #15 | Exceptional $46,502 |
| Indians (Asian) | 100.0 /100 | #16 | Exceptional $46,481 |
| Immigrants | South Central Asia | 100.0 /100 | #17 | Exceptional $46,324 |
| Cypriots | 100.0 /100 | #18 | Exceptional $45,570 |
| Eastern Europeans | 100.0 /100 | #19 | Exceptional $45,385 |
| Immigrants | Japan | 100.0 /100 | #20 | Exceptional $45,323 |
| Cambodians | 100.0 /100 | #21 | Exceptional $45,014 |
| Immigrants | Greece | 100.0 /100 | #22 | Exceptional $44,976 |
| Burmese | 100.0 /100 | #23 | Exceptional $44,911 |
| Immigrants | Korea | 100.0 /100 | #24 | Exceptional $44,847 |
| Immigrants | Sweden | 100.0 /100 | #25 | Exceptional $44,774 |
| Immigrants | Belarus | 100.0 /100 | #26 | Exceptional $44,757 |
| Turks | 100.0 /100 | #27 | Exceptional $44,695 |