Cambodian vs Black/African American Median Female Earnings
COMPARE
Cambodian
Black/African American
Median Female Earnings
Median Female Earnings Comparison
Cambodians
Blacks/African Americans
$45,014
MEDIAN FEMALE EARNINGS
100.0/ 100
METRIC RATING
21st/ 347
METRIC RANK
$35,315
MEDIAN FEMALE EARNINGS
0.0/ 100
METRIC RATING
302nd/ 347
METRIC RANK
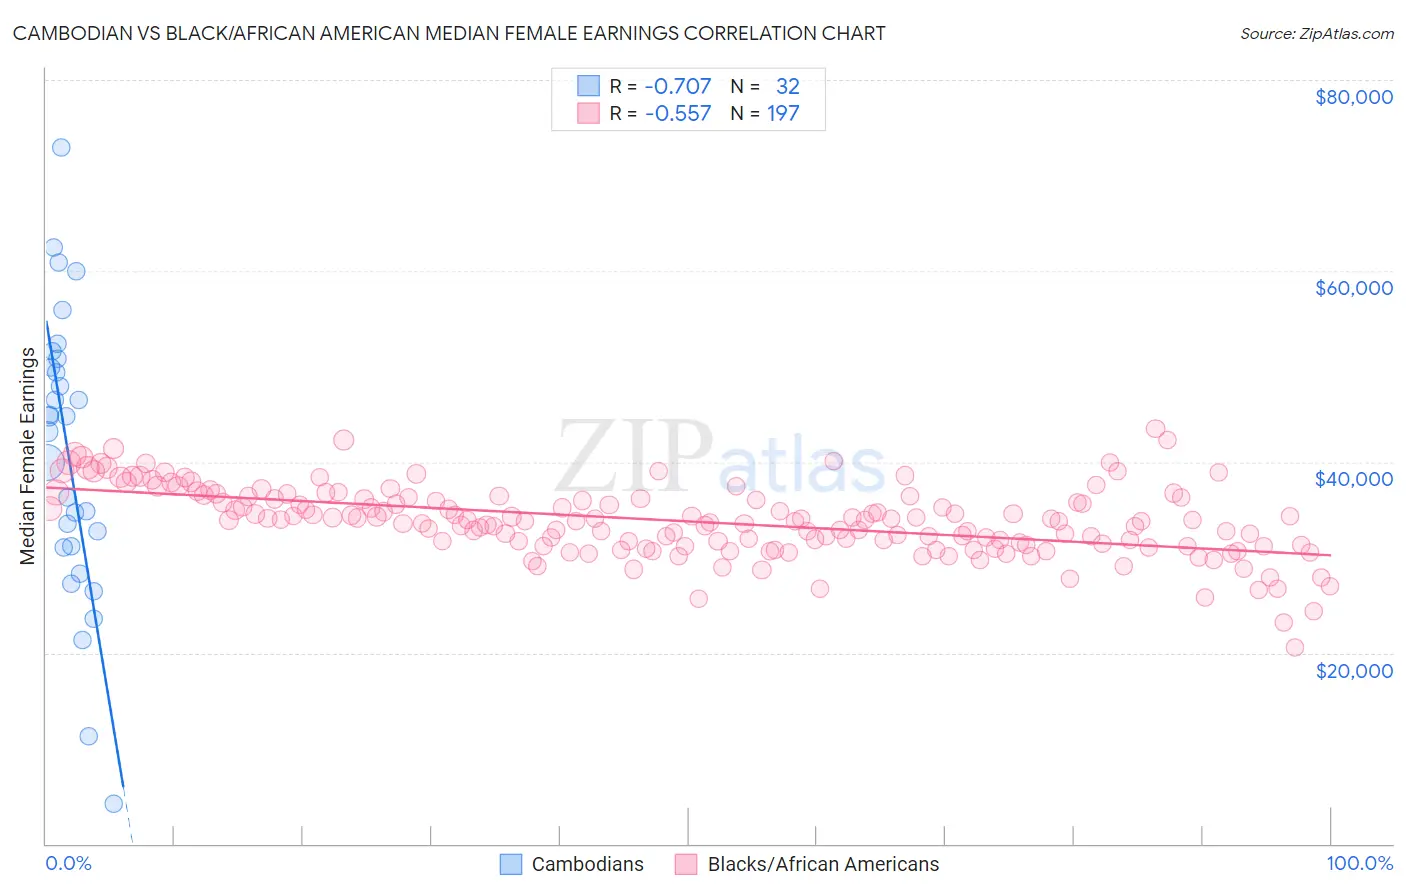
Cambodian vs Black/African American Median Female Earnings Correlation Chart
The statistical analysis conducted on geographies consisting of 102,513,966 people shows a strong negative correlation between the proportion of Cambodians and median female earnings in the United States with a correlation coefficient (R) of -0.707 and weighted average of $45,014. Similarly, the statistical analysis conducted on geographies consisting of 562,880,101 people shows a substantial negative correlation between the proportion of Blacks/African Americans and median female earnings in the United States with a correlation coefficient (R) of -0.557 and weighted average of $35,315, a difference of 27.5%.
Median Female Earnings Correlation Summary
| Measurement | Cambodian | Black/African American |
| Minimum | $4,132 | $20,616 |
| Maximum | $72,888 | $43,481 |
| Range | $68,756 | $22,865 |
| Mean | $40,669 | $33,784 |
| Median | $43,973 | $33,890 |
| Interquartile 25% (IQ1) | $31,093 | $31,353 |
| Interquartile 75% (IQ3) | $50,357 | $36,250 |
| Interquartile Range (IQR) | $19,265 | $4,897 |
| Standard Deviation (Sample) | $15,041 | $3,688 |
| Standard Deviation (Population) | $14,804 | $3,678 |
Similar Demographics by Median Female Earnings
Demographics Similar to Cambodians by Median Female Earnings
In terms of median female earnings, the demographic groups most similar to Cambodians are Immigrants from Greece ($44,976, a difference of 0.080%), Burmese ($44,911, a difference of 0.23%), Immigrants from Korea ($44,847, a difference of 0.37%), Immigrants from Sweden ($44,774, a difference of 0.54%), and Immigrants from Belarus ($44,757, a difference of 0.57%).
| Demographics | Rating | Rank | Median Female Earnings |
| Soviet Union | 100.0 /100 | #14 | Exceptional $46,556 |
| Immigrants | Eastern Asia | 100.0 /100 | #15 | Exceptional $46,502 |
| Indians (Asian) | 100.0 /100 | #16 | Exceptional $46,481 |
| Immigrants | South Central Asia | 100.0 /100 | #17 | Exceptional $46,324 |
| Cypriots | 100.0 /100 | #18 | Exceptional $45,570 |
| Eastern Europeans | 100.0 /100 | #19 | Exceptional $45,385 |
| Immigrants | Japan | 100.0 /100 | #20 | Exceptional $45,323 |
| Cambodians | 100.0 /100 | #21 | Exceptional $45,014 |
| Immigrants | Greece | 100.0 /100 | #22 | Exceptional $44,976 |
| Burmese | 100.0 /100 | #23 | Exceptional $44,911 |
| Immigrants | Korea | 100.0 /100 | #24 | Exceptional $44,847 |
| Immigrants | Sweden | 100.0 /100 | #25 | Exceptional $44,774 |
| Immigrants | Belarus | 100.0 /100 | #26 | Exceptional $44,757 |
| Turks | 100.0 /100 | #27 | Exceptional $44,695 |
| Immigrants | Russia | 100.0 /100 | #28 | Exceptional $44,680 |
Demographics Similar to Blacks/African Americans by Median Female Earnings
In terms of median female earnings, the demographic groups most similar to Blacks/African Americans are Immigrants from Latin America ($35,307, a difference of 0.020%), Pima ($35,326, a difference of 0.030%), Crow ($35,266, a difference of 0.14%), Yuman ($35,377, a difference of 0.18%), and Immigrants from Guatemala ($35,444, a difference of 0.36%).
| Demographics | Rating | Rank | Median Female Earnings |
| Comanche | 0.0 /100 | #295 | Tragic $35,661 |
| Mexican American Indians | 0.0 /100 | #296 | Tragic $35,629 |
| Hmong | 0.0 /100 | #297 | Tragic $35,498 |
| Immigrants | Micronesia | 0.0 /100 | #298 | Tragic $35,477 |
| Immigrants | Guatemala | 0.0 /100 | #299 | Tragic $35,444 |
| Yuman | 0.0 /100 | #300 | Tragic $35,377 |
| Pima | 0.0 /100 | #301 | Tragic $35,326 |
| Blacks/African Americans | 0.0 /100 | #302 | Tragic $35,315 |
| Immigrants | Latin America | 0.0 /100 | #303 | Tragic $35,307 |
| Crow | 0.0 /100 | #304 | Tragic $35,266 |
| Bahamians | 0.0 /100 | #305 | Tragic $35,125 |
| Fijians | 0.0 /100 | #306 | Tragic $35,114 |
| Sioux | 0.0 /100 | #307 | Tragic $35,063 |
| Immigrants | Bahamas | 0.0 /100 | #308 | Tragic $35,027 |
| Hondurans | 0.0 /100 | #309 | Tragic $35,013 |