Ecuadorian vs Eastern European Median Male Earnings
COMPARE
Ecuadorian
Eastern European
Median Male Earnings
Median Male Earnings Comparison
Ecuadorians
Eastern Europeans
$51,596
MEDIAN MALE EARNINGS
5.5/ 100
METRIC RATING
223rd/ 347
METRIC RANK
$66,472
MEDIAN MALE EARNINGS
100.0/ 100
METRIC RATING
16th/ 347
METRIC RANK
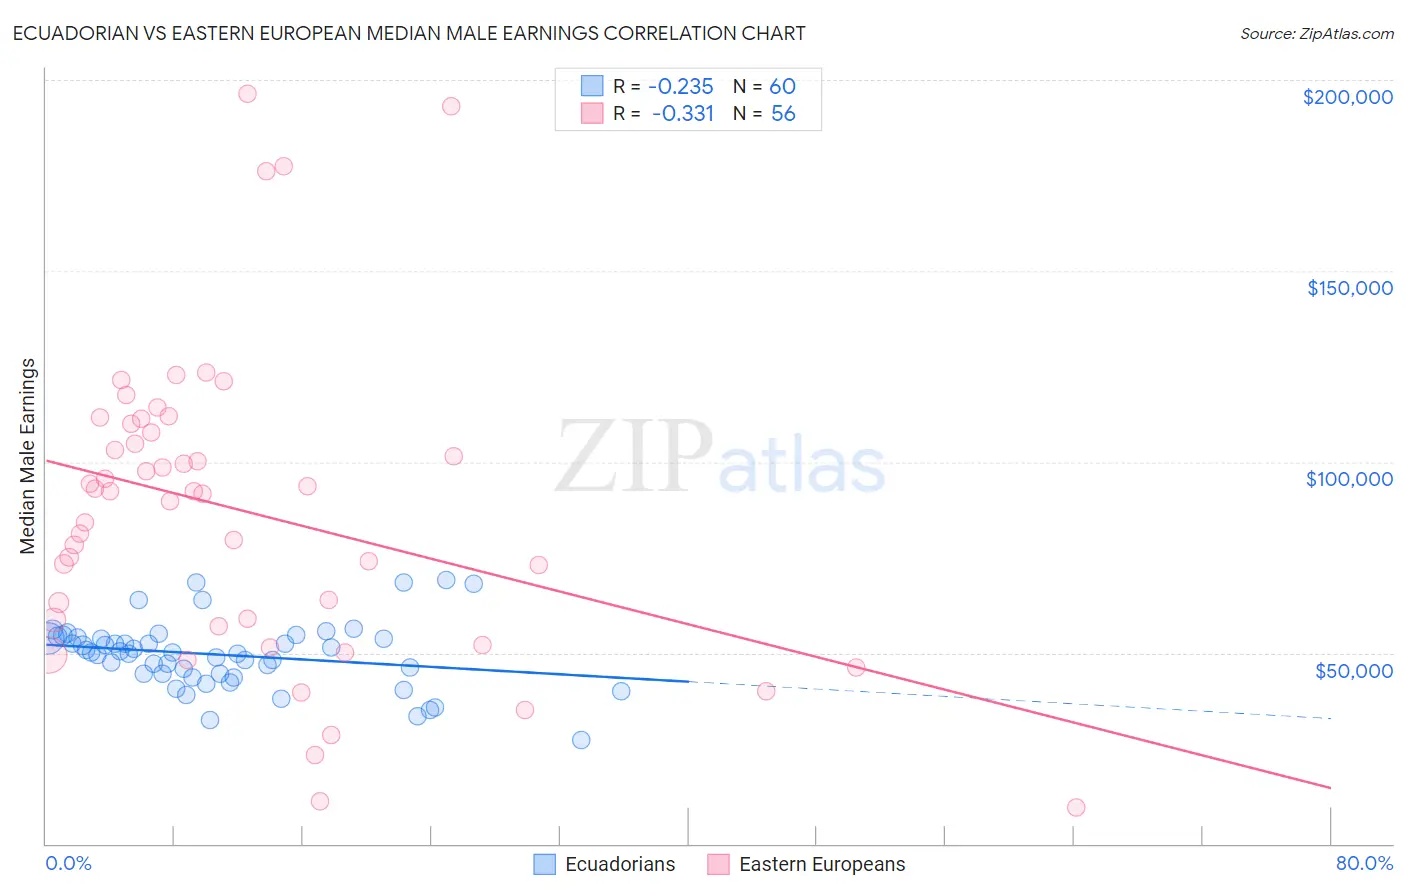
Ecuadorian vs Eastern European Median Male Earnings Correlation Chart
The statistical analysis conducted on geographies consisting of 317,782,884 people shows a weak negative correlation between the proportion of Ecuadorians and median male earnings in the United States with a correlation coefficient (R) of -0.235 and weighted average of $51,596. Similarly, the statistical analysis conducted on geographies consisting of 460,960,346 people shows a mild negative correlation between the proportion of Eastern Europeans and median male earnings in the United States with a correlation coefficient (R) of -0.331 and weighted average of $66,472, a difference of 28.8%.
Median Male Earnings Correlation Summary
| Measurement | Ecuadorian | Eastern European |
| Minimum | $27,125 | $9,364 |
| Maximum | $69,080 | $196,250 |
| Range | $41,955 | $186,886 |
| Mean | $49,474 | $86,901 |
| Median | $50,085 | $91,970 |
| Interquartile 25% (IQ1) | $44,427 | $57,711 |
| Interquartile 75% (IQ3) | $53,952 | $108,812 |
| Interquartile Range (IQR) | $9,525 | $51,101 |
| Standard Deviation (Sample) | $8,750 | $40,387 |
| Standard Deviation (Population) | $8,677 | $40,024 |
Similar Demographics by Median Male Earnings
Demographics Similar to Ecuadorians by Median Male Earnings
In terms of median male earnings, the demographic groups most similar to Ecuadorians are Immigrants from Cambodia ($51,594, a difference of 0.0%), Immigrants from Bangladesh ($51,642, a difference of 0.090%), Immigrants from Senegal ($51,647, a difference of 0.10%), Immigrants from Sudan ($51,489, a difference of 0.21%), and Japanese ($51,473, a difference of 0.24%).
| Demographics | Rating | Rank | Median Male Earnings |
| Immigrants | Venezuela | 8.3 /100 | #216 | Tragic $52,041 |
| Nigerians | 8.3 /100 | #217 | Tragic $52,039 |
| Immigrants | Panama | 7.7 /100 | #218 | Tragic $51,962 |
| Immigrants | Ghana | 6.9 /100 | #219 | Tragic $51,836 |
| Immigrants | Armenia | 6.6 /100 | #220 | Tragic $51,793 |
| Immigrants | Senegal | 5.8 /100 | #221 | Tragic $51,647 |
| Immigrants | Bangladesh | 5.8 /100 | #222 | Tragic $51,642 |
| Ecuadorians | 5.5 /100 | #223 | Tragic $51,596 |
| Immigrants | Cambodia | 5.5 /100 | #224 | Tragic $51,594 |
| Immigrants | Sudan | 5.0 /100 | #225 | Tragic $51,489 |
| Japanese | 4.9 /100 | #226 | Tragic $51,473 |
| Trinidadians and Tobagonians | 4.8 /100 | #227 | Tragic $51,446 |
| Samoans | 4.6 /100 | #228 | Tragic $51,389 |
| Immigrants | Trinidad and Tobago | 4.5 /100 | #229 | Tragic $51,376 |
| Immigrants | Nigeria | 4.2 /100 | #230 | Tragic $51,310 |
Demographics Similar to Eastern Europeans by Median Male Earnings
In terms of median male earnings, the demographic groups most similar to Eastern Europeans are Immigrants from Belgium ($66,125, a difference of 0.53%), Indian (Asian) ($66,078, a difference of 0.60%), Immigrants from Eastern Asia ($66,903, a difference of 0.65%), Okinawan ($67,232, a difference of 1.1%), and Immigrants from China ($67,353, a difference of 1.3%).
| Demographics | Rating | Rank | Median Male Earnings |
| Immigrants | South Central Asia | 100.0 /100 | #9 | Exceptional $68,960 |
| Immigrants | Israel | 100.0 /100 | #10 | Exceptional $68,716 |
| Immigrants | Ireland | 100.0 /100 | #11 | Exceptional $67,698 |
| Immigrants | Australia | 100.0 /100 | #12 | Exceptional $67,634 |
| Immigrants | China | 100.0 /100 | #13 | Exceptional $67,353 |
| Okinawans | 100.0 /100 | #14 | Exceptional $67,232 |
| Immigrants | Eastern Asia | 100.0 /100 | #15 | Exceptional $66,903 |
| Eastern Europeans | 100.0 /100 | #16 | Exceptional $66,472 |
| Immigrants | Belgium | 100.0 /100 | #17 | Exceptional $66,125 |
| Indians (Asian) | 100.0 /100 | #18 | Exceptional $66,078 |
| Cypriots | 100.0 /100 | #19 | Exceptional $65,549 |
| Immigrants | Japan | 100.0 /100 | #20 | Exceptional $65,518 |
| Immigrants | Sweden | 100.0 /100 | #21 | Exceptional $65,406 |
| Burmese | 100.0 /100 | #22 | Exceptional $65,236 |
| Immigrants | Korea | 100.0 /100 | #23 | Exceptional $65,079 |