Burmese vs Immigrants from Czechoslovakia Master's Degree

COMPARE

Burmese
Race
Ancestry
AfghanAfricanAlaska NativeAlaskan AthabascanAlbanianAleutAlsatianAmericanApacheArabArapahoArgentineanArmenianAssyrian/Chaldean/SyriacAustralianAustrianBahamianBangladeshiBarbadianBasqueBelgianBelizeanBermudanBhutaneseBlackfeetBolivianBrazilianBritishBritish West IndianBulgarianBurmeseCajunCambodianCanadianCape VerdeanCarpatho RusynCelticCentral AmericanCentral American IndianCherokeeCheyenneChickasawChileanChineseChippewaChoctawColombianColvilleComancheCosta RicanCreeCreekCroatianCrowCubanCypriotCzechCzechoslovakianDanishDelawareDominicanDutchDutch West IndianEastern EuropeanEcuadorianEgyptianEnglishEstonianEthiopianEuropeanFijianFilipinoFinnishFrenchFrench American IndianFrench CanadianGermanGerman RussianGhanaianGreekGuamanian/ChamorroGuatemalanGuyaneseHaitianHmongHonduranHopiHoumaHungarianIcelanderIndian (Asian)IndonesianInupiatIranianIraqiIrishIroquoisIsraeliItalianJamaicanJapaneseJordanianKenyanKiowaKoreanLaotianLatvianLebaneseLiberianLithuanianLumbeeLuxembourgerMacedonianMalaysianMalteseMarshalleseMenomineeMexicanMexican American IndianMongolianMoroccanNative HawaiianNavajoNepaleseNew ZealanderNicaraguanNigerianNorthern EuropeanNorwegianOkinawanOsageOttawaPaiutePakistaniPalestinianPanamanianParaguayanPennsylvania GermanPeruvianPimaPolishPortuguesePotawatomiPuebloPuerto RicanPuget Sound SalishRomanianRussianSalvadoranSamoanScandinavianScotch-IrishScottishSeminoleSenegaleseSerbianShoshoneSierra LeoneanSiouxSlavicSlovakSloveneSomaliSouth AfricanSouth AmericanSouth American IndianSoviet UnionSpaniardSpanishSpanish AmericanSpanish American IndianSri LankanSubsaharan AfricanSudaneseSwedishSwissSyrianTaiwaneseThaiTlingit-HaidaTohono O'OdhamTonganTrinidadian and TobagonianTsimshianTurkishU.S. Virgin IslanderUgandanUkrainianUruguayanUteVenezuelanVietnameseWelshWest IndianYakamaYaquiYugoslavianYumanYup'ikZimbabwean
Immigration
NonimmigrantsImmigrantsAfghanistanAfricaAlbaniaArgentinaArmeniaAsiaAustraliaAustriaBahamasBangladeshBarbadosBelarusBelgiumBelizeBoliviaBosnia and HerzegovinaBrazilBulgariaBurma/MyanmarCabo VerdeCambodiaCameroonCanadaCaribbeanCentral AmericaChileChinaColombiaCongoCosta RicaCroatiaCubaDenmarkDominicaDominican RepublicEastern AfricaEastern AsiaEastern EuropeEcuadorEgyptEl SalvadorEnglandEritreaEthiopiaEuropeFijiFranceGermanyGhanaGreeceGrenadaGuatemalaGuyanaHaitiHondurasHong KongHungaryIndiaIndonesiaIranIraqIrelandIsraelItalyJamaicaJapanJordanKazakhstanKenyaKoreaKuwaitLaosLatin AmericaLatviaLebanonLiberiaLithuaniaMalaysiaMexicoMicronesiaMiddle AfricaMoldovaMoroccoNepalNetherlandsNicaraguaNigeriaNorth AmericaNorth MacedoniaNorthern AfricaNorthern EuropeNorwayOceaniaPakistanPanamaPeruPhilippinesPolandPortugalRomaniaRussiaSaudi ArabiaScotlandSenegalSerbiaSierra LeoneSingaporeSomaliaSouth AfricaSouth AmericaSouth Central AsiaSouth Eastern AsiaSouthern EuropeSpainSri LankaSt. Vincent and the GrenadinesSudanSwedenSwitzerlandSyriaTaiwanThailandTrinidad and TobagoTurkeyUgandaUkraineUruguayUzbekistanVenezuelaVietnamWest IndiesWestern AfricaWestern AsiaWestern EuropeYemenZaireZimbabweAzores
Immigrants from Czechoslovakia
Race
Ancestry
AfghanAfricanAlaska NativeAlaskan AthabascanAlbanianAleutAlsatianAmericanApacheArabArapahoArgentineanArmenianAssyrian/Chaldean/SyriacAustralianAustrianBahamianBangladeshiBarbadianBasqueBelgianBelizeanBermudanBhutaneseBlackfeetBolivianBrazilianBritishBritish West IndianBulgarianCajunCambodianCanadianCape VerdeanCarpatho RusynCelticCentral AmericanCentral American IndianCherokeeCheyenneChickasawChileanChineseChippewaChoctawColombianColvilleComancheCosta RicanCreeCreekCroatianCrowCubanCypriotCzechCzechoslovakianDanishDelawareDominicanDutchDutch West IndianEastern EuropeanEcuadorianEgyptianEnglishEstonianEthiopianEuropeanFijianFilipinoFinnishFrenchFrench American IndianFrench CanadianGermanGerman RussianGhanaianGreekGuamanian/ChamorroGuatemalanGuyaneseHaitianHmongHonduranHopiHoumaHungarianIcelanderIndian (Asian)IndonesianInupiatIranianIraqiIrishIroquoisIsraeliItalianJamaicanJapaneseJordanianKenyanKiowaKoreanLaotianLatvianLebaneseLiberianLithuanianLumbeeLuxembourgerMacedonianMalaysianMalteseMarshalleseMenomineeMexicanMexican American IndianMongolianMoroccanNative HawaiianNavajoNepaleseNew ZealanderNicaraguanNigerianNorthern EuropeanNorwegianOkinawanOsageOttawaPaiutePakistaniPalestinianPanamanianParaguayanPennsylvania GermanPeruvianPimaPolishPortuguesePotawatomiPuebloPuerto RicanPuget Sound SalishRomanianRussianSalvadoranSamoanScandinavianScotch-IrishScottishSeminoleSenegaleseSerbianShoshoneSierra LeoneanSiouxSlavicSlovakSloveneSomaliSouth AfricanSouth AmericanSouth American IndianSoviet UnionSpaniardSpanishSpanish AmericanSpanish American IndianSri LankanSubsaharan AfricanSudaneseSwedishSwissSyrianTaiwaneseThaiTlingit-HaidaTohono O'OdhamTonganTrinidadian and TobagonianTsimshianTurkishU.S. Virgin IslanderUgandanUkrainianUruguayanUteVenezuelanVietnameseWelshWest IndianYakamaYaquiYugoslavianYumanYup'ikZimbabwean
Immigration
NonimmigrantsImmigrantsAfghanistanAfricaAlbaniaArgentinaArmeniaAsiaAustraliaAustriaBahamasBangladeshBarbadosBelarusBelgiumBelizeBoliviaBosnia and HerzegovinaBrazilBulgariaBurma/MyanmarCabo VerdeCambodiaCameroonCanadaCaribbeanCentral AmericaChileChinaColombiaCongoCosta RicaCroatiaCubaCzechoslovakiaDenmarkDominicaDominican RepublicEastern AfricaEastern AsiaEastern EuropeEcuadorEgyptEl SalvadorEnglandEritreaEthiopiaEuropeFijiFranceGermanyGhanaGreeceGrenadaGuatemalaGuyanaHaitiHondurasHong KongHungaryIndiaIndonesiaIranIraqIrelandIsraelItalyJamaicaJapanJordanKazakhstanKenyaKoreaKuwaitLaosLatin AmericaLatviaLebanonLiberiaLithuaniaMalaysiaMexicoMicronesiaMiddle AfricaMoldovaMoroccoNepalNetherlandsNicaraguaNigeriaNorth AmericaNorth MacedoniaNorthern AfricaNorthern EuropeNorwayOceaniaPakistanPanamaPeruPhilippinesPolandPortugalRomaniaRussiaSaudi ArabiaScotlandSenegalSerbiaSierra LeoneSingaporeSomaliaSouth AfricaSouth AmericaSouth Central AsiaSouth Eastern AsiaSouthern EuropeSpainSri LankaSt. Vincent and the GrenadinesSudanSwedenSwitzerlandSyriaTaiwanThailandTrinidad and TobagoTurkeyUgandaUkraineUruguayUzbekistanVenezuelaVietnamWest IndiesWestern AfricaWestern AsiaWestern EuropeYemenZaireZimbabweAzores
Master's Degree
Income
Poverty
Unemployment
Labor Participation
Family Structure
Vehicle Availability
Education Level
Disability

Master's Degree Comparison

Burmese

Immigrants from Czechoslovakia

Exceptional
Exceptional
19.7%
MASTER'S DEGREE
100.0/ 100
METRIC RATING
32nd/ 347
METRIC RANK
18.5%
MASTER'S DEGREE
99.9/ 100
METRIC RATING
53rd/ 347
METRIC RANK

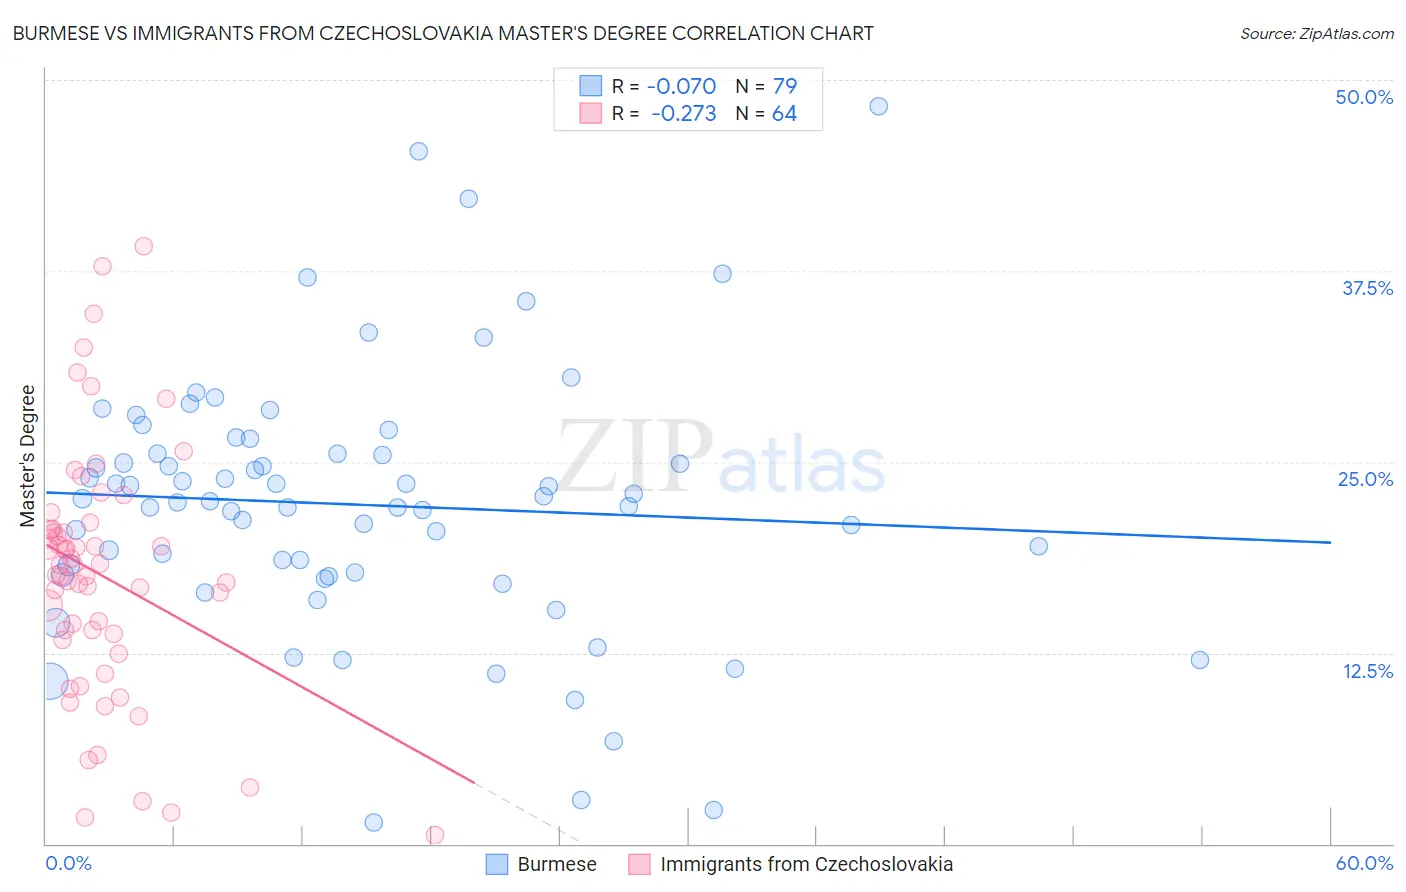
Burmese vs Immigrants from Czechoslovakia Master's Degree Correlation Chart

The statistical analysis conducted on geographies consisting of 465,142,202 people shows a slight negative correlation between the proportion of Burmese and percentage of population with at least master's degree education in the United States with a correlation coefficient (R) of -0.070 and weighted average of 19.7%. Similarly, the statistical analysis conducted on geographies consisting of 195,445,199 people shows a weak negative correlation between the proportion of Immigrants from Czechoslovakia and percentage of population with at least master's degree education in the United States with a correlation coefficient (R) of -0.273 and weighted average of 18.5%, a difference of 6.2%.
Burmese vs Immigrants from Czechoslovakia Master's Degree

Master's Degree Correlation Summary

MeasurementBurmeseImmigrants from Czechoslovakia
Minimum1.4%0.60%
Maximum48.2%39.2%
Range46.8%38.6%
Mean22.2%17.6%
Median22.5%17.9%
Interquartile 25% (IQ1)17.6%13.6%
Interquartile 75% (IQ3)25.5%20.6%
Interquartile Range (IQR)8.0%7.0%
Standard Deviation (Sample)8.6%8.2%
Standard Deviation (Population)8.5%8.1%

Similar Demographics by Master's Degree

Demographics Similar to Burmese by Master's Degree

In terms of master's degree, the demographic groups most similar to Burmese are Immigrants from Korea (19.7%, a difference of 0.070%), Immigrants from Turkey (19.7%, a difference of 0.080%), Latvian (19.8%, a difference of 0.58%), Russian (19.5%, a difference of 0.79%), and Immigrants from Denmark (19.5%, a difference of 0.81%).
DemographicsRating | RankMaster's Degree
Immigrants | Japan
100.0
/100
|
#25
Exceptional
20.0%
Cambodians
100.0
/100
|
#26
Exceptional
20.0%
Immigrants | Sri Lanka
100.0
/100
|
#27
Exceptional
19.9%
Turks
100.0
/100
|
#28
Exceptional
19.9%
Latvians
100.0
/100
|
#29
Exceptional
19.8%
Immigrants | Turkey
100.0
/100
|
#30
Exceptional
19.7%
Immigrants | Korea
100.0
/100
|
#31
Exceptional
19.7%
Burmese
100.0
/100
|
#32
Exceptional
19.7%
Russians
100.0
/100
|
#33
Exceptional
19.5%
Immigrants | Denmark
100.0
/100
|
#34
Exceptional
19.5%
Immigrants | Northern Europe
100.0
/100
|
#35
Exceptional
19.5%
Immigrants | Russia
100.0
/100
|
#36
Exceptional
19.4%
Mongolians
100.0
/100
|
#37
Exceptional
19.4%
Bolivians
100.0
/100
|
#38
Exceptional
19.3%
Immigrants | Spain
100.0
/100
|
#39
Exceptional
19.1%

Demographics Similar to Immigrants from Czechoslovakia by Master's Degree

In terms of master's degree, the demographic groups most similar to Immigrants from Czechoslovakia are Immigrants from Kuwait (18.6%, a difference of 0.080%), Immigrants from Lithuania (18.5%, a difference of 0.31%), Immigrants from Serbia (18.5%, a difference of 0.34%), Asian (18.4%, a difference of 0.57%), and Immigrants from Asia (18.4%, a difference of 0.70%).
DemographicsRating | RankMaster's Degree
Immigrants | Norway
100.0
/100
|
#46
Exceptional
18.8%
Immigrants | Austria
100.0
/100
|
#47
Exceptional
18.8%
Paraguayans
100.0
/100
|
#48
Exceptional
18.8%
Estonians
100.0
/100
|
#49
Exceptional
18.8%
Bulgarians
100.0
/100
|
#50
Exceptional
18.8%
Immigrants | South Africa
100.0
/100
|
#51
Exceptional
18.8%
Immigrants | Kuwait
100.0
/100
|
#52
Exceptional
18.6%
Immigrants | Czechoslovakia
99.9
/100
|
#53
Exceptional
18.5%
Immigrants | Lithuania
99.9
/100
|
#54
Exceptional
18.5%
Immigrants | Serbia
99.9
/100
|
#55
Exceptional
18.5%
Asians
99.9
/100
|
#56
Exceptional
18.4%
Immigrants | Asia
99.9
/100
|
#57
Exceptional
18.4%
Australians
99.9
/100
|
#58
Exceptional
18.4%
Immigrants | Bulgaria
99.9
/100
|
#59
Exceptional
18.3%
New Zealanders
99.9
/100
|
#60
Exceptional
18.3%