Burmese vs Celtic Median Earnings
COMPARE
Burmese
Celtic
Median Earnings
Median Earnings Comparison
Burmese
Celtics
$54,559
MEDIAN EARNINGS
100.0/ 100
METRIC RATING
21st/ 347
METRIC RANK
$45,732
MEDIAN EARNINGS
27.2/ 100
METRIC RATING
201st/ 347
METRIC RANK
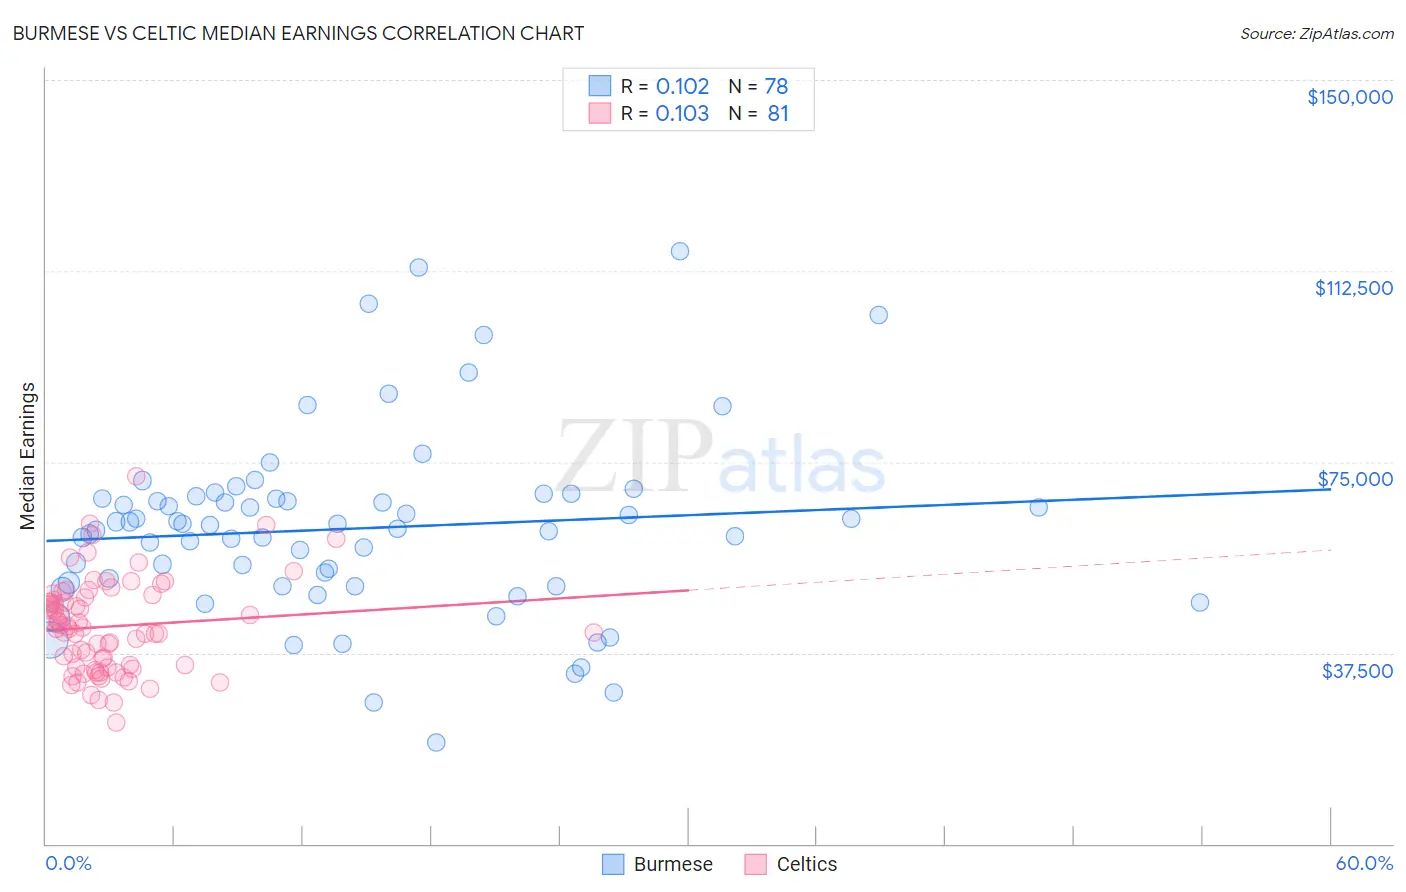
Burmese vs Celtic Median Earnings Correlation Chart
The statistical analysis conducted on geographies consisting of 465,399,641 people shows a poor positive correlation between the proportion of Burmese and median earnings in the United States with a correlation coefficient (R) of 0.102 and weighted average of $54,559. Similarly, the statistical analysis conducted on geographies consisting of 168,867,558 people shows a poor positive correlation between the proportion of Celtics and median earnings in the United States with a correlation coefficient (R) of 0.103 and weighted average of $45,732, a difference of 19.3%.
Median Earnings Correlation Summary
| Measurement | Burmese | Celtic |
| Minimum | $20,000 | $23,710 |
| Maximum | $116,380 | $72,162 |
| Range | $96,380 | $48,452 |
| Mean | $61,901 | $42,685 |
| Median | $62,283 | $42,318 |
| Interquartile 25% (IQ1) | $50,678 | $34,608 |
| Interquartile 75% (IQ3) | $67,756 | $48,561 |
| Interquartile Range (IQR) | $17,078 | $13,953 |
| Standard Deviation (Sample) | $18,078 | $9,238 |
| Standard Deviation (Population) | $17,962 | $9,181 |
Similar Demographics by Median Earnings
Demographics Similar to Burmese by Median Earnings
In terms of median earnings, the demographic groups most similar to Burmese are Immigrants from Korea ($54,530, a difference of 0.050%), Cypriot ($54,589, a difference of 0.060%), Immigrants from Sweden ($54,478, a difference of 0.15%), Immigrants from Belgium ($54,679, a difference of 0.22%), and Soviet Union ($54,290, a difference of 0.50%).
| Demographics | Rating | Rank | Median Earnings |
| Immigrants | Australia | 100.0 /100 | #14 | Exceptional $56,305 |
| Indians (Asian) | 100.0 /100 | #15 | Exceptional $56,253 |
| Immigrants | Eastern Asia | 100.0 /100 | #16 | Exceptional $56,183 |
| Eastern Europeans | 100.0 /100 | #17 | Exceptional $55,084 |
| Immigrants | Japan | 100.0 /100 | #18 | Exceptional $54,938 |
| Immigrants | Belgium | 100.0 /100 | #19 | Exceptional $54,679 |
| Cypriots | 100.0 /100 | #20 | Exceptional $54,589 |
| Burmese | 100.0 /100 | #21 | Exceptional $54,559 |
| Immigrants | Korea | 100.0 /100 | #22 | Exceptional $54,530 |
| Immigrants | Sweden | 100.0 /100 | #23 | Exceptional $54,478 |
| Soviet Union | 100.0 /100 | #24 | Exceptional $54,290 |
| Turks | 100.0 /100 | #25 | Exceptional $53,919 |
| Immigrants | Northern Europe | 100.0 /100 | #26 | Exceptional $53,872 |
| Asians | 100.0 /100 | #27 | Exceptional $53,690 |
| Immigrants | France | 100.0 /100 | #28 | Exceptional $53,490 |
Demographics Similar to Celtics by Median Earnings
In terms of median earnings, the demographic groups most similar to Celtics are Immigrants from Trinidad and Tobago ($45,729, a difference of 0.010%), Welsh ($45,710, a difference of 0.050%), Immigrants from Uruguay ($45,682, a difference of 0.11%), Tongan ($45,665, a difference of 0.15%), and Immigrants from Barbados ($45,816, a difference of 0.18%).
| Demographics | Rating | Rank | Median Earnings |
| Immigrants | Costa Rica | 33.0 /100 | #194 | Fair $45,928 |
| Immigrants | St. Vincent and the Grenadines | 32.4 /100 | #195 | Fair $45,908 |
| Yugoslavians | 30.5 /100 | #196 | Fair $45,846 |
| Barbadians | 30.5 /100 | #197 | Fair $45,846 |
| Trinidadians and Tobagonians | 29.7 /100 | #198 | Fair $45,820 |
| Immigrants | Barbados | 29.6 /100 | #199 | Fair $45,816 |
| Immigrants | Azores | 29.5 /100 | #200 | Fair $45,812 |
| Celtics | 27.2 /100 | #201 | Fair $45,732 |
| Immigrants | Trinidad and Tobago | 27.1 /100 | #202 | Fair $45,729 |
| Welsh | 26.6 /100 | #203 | Fair $45,710 |
| Immigrants | Uruguay | 25.9 /100 | #204 | Fair $45,682 |
| Tongans | 25.4 /100 | #205 | Fair $45,665 |
| Immigrants | Ghana | 24.8 /100 | #206 | Fair $45,641 |
| Immigrants | Senegal | 24.0 /100 | #207 | Fair $45,611 |
| Immigrants | Bosnia and Herzegovina | 23.7 /100 | #208 | Fair $45,600 |