Immigrants from Hungary vs Immigrants from England Median Male Earnings
COMPARE
Immigrants from Hungary
Immigrants from England
Median Male Earnings
Median Male Earnings Comparison
Immigrants from Hungary
Immigrants from England
$59,806
MEDIAN MALE EARNINGS
99.5/ 100
METRIC RATING
80th/ 347
METRIC RANK
$59,527
MEDIAN MALE EARNINGS
99.3/ 100
METRIC RATING
86th/ 347
METRIC RANK
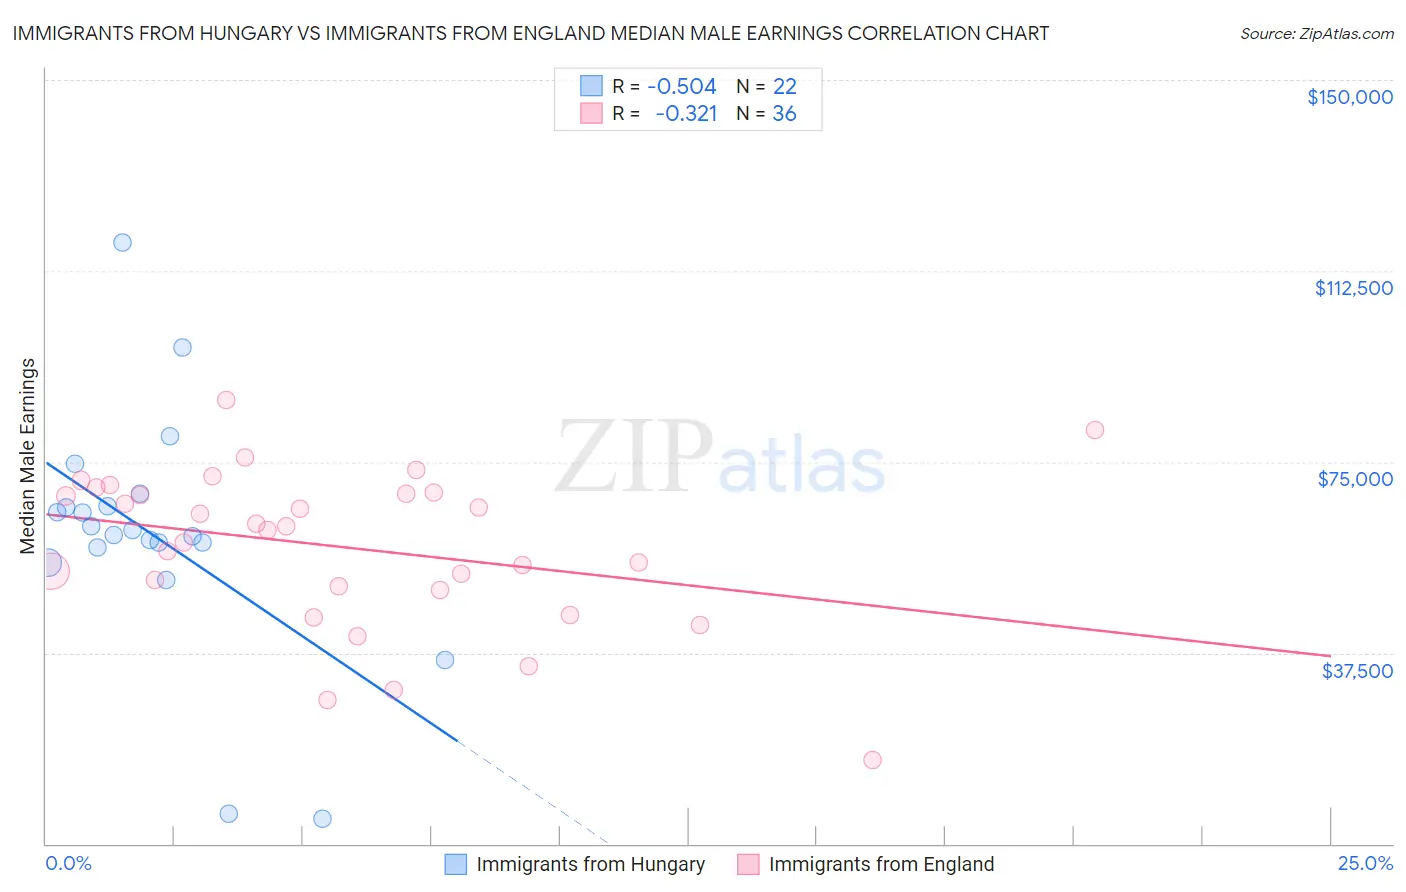
Immigrants from Hungary vs Immigrants from England Median Male Earnings Correlation Chart
The statistical analysis conducted on geographies consisting of 195,676,338 people shows a substantial negative correlation between the proportion of Immigrants from Hungary and median male earnings in the United States with a correlation coefficient (R) of -0.504 and weighted average of $59,806. Similarly, the statistical analysis conducted on geographies consisting of 391,689,688 people shows a mild negative correlation between the proportion of Immigrants from England and median male earnings in the United States with a correlation coefficient (R) of -0.321 and weighted average of $59,527, a difference of 0.47%.
Median Male Earnings Correlation Summary
| Measurement | Immigrants from Hungary | Immigrants from England |
| Minimum | $4,861 | $16,326 |
| Maximum | $118,099 | $87,186 |
| Range | $113,238 | $70,860 |
| Mean | $60,734 | $58,179 |
| Median | $61,103 | $62,084 |
| Interquartile 25% (IQ1) | $58,200 | $50,179 |
| Interquartile 75% (IQ3) | $66,315 | $68,837 |
| Interquartile Range (IQR) | $8,115 | $18,658 |
| Standard Deviation (Sample) | $24,141 | $15,499 |
| Standard Deviation (Population) | $23,586 | $15,282 |
Demographics Similar to Immigrants from Hungary and Immigrants from England by Median Male Earnings
In terms of median male earnings, the demographic groups most similar to Immigrants from Hungary are Immigrants from Ukraine ($59,820, a difference of 0.020%), Ukrainian ($59,728, a difference of 0.13%), Croatian ($59,715, a difference of 0.15%), Immigrants from Italy ($59,691, a difference of 0.19%), and Immigrants from Egypt ($59,925, a difference of 0.20%). Similarly, the demographic groups most similar to Immigrants from England are Macedonian ($59,522, a difference of 0.010%), Italian ($59,551, a difference of 0.040%), Afghan ($59,554, a difference of 0.050%), Immigrants from Argentina ($59,491, a difference of 0.060%), and Immigrants from Moldova ($59,417, a difference of 0.18%).
| Demographics | Rating | Rank | Median Male Earnings |
| Immigrants | North America | 99.7 /100 | #73 | Exceptional $60,265 |
| Argentineans | 99.6 /100 | #74 | Exceptional $60,117 |
| Immigrants | Bolivia | 99.6 /100 | #75 | Exceptional $60,088 |
| Romanians | 99.6 /100 | #76 | Exceptional $60,063 |
| Paraguayans | 99.5 /100 | #77 | Exceptional $59,975 |
| Immigrants | Egypt | 99.5 /100 | #78 | Exceptional $59,925 |
| Immigrants | Ukraine | 99.5 /100 | #79 | Exceptional $59,820 |
| Immigrants | Hungary | 99.5 /100 | #80 | Exceptional $59,806 |
| Ukrainians | 99.4 /100 | #81 | Exceptional $59,728 |
| Croatians | 99.4 /100 | #82 | Exceptional $59,715 |
| Immigrants | Italy | 99.4 /100 | #83 | Exceptional $59,691 |
| Afghans | 99.3 /100 | #84 | Exceptional $59,554 |
| Italians | 99.3 /100 | #85 | Exceptional $59,551 |
| Immigrants | England | 99.3 /100 | #86 | Exceptional $59,527 |
| Macedonians | 99.3 /100 | #87 | Exceptional $59,522 |
| Immigrants | Argentina | 99.3 /100 | #88 | Exceptional $59,491 |
| Immigrants | Moldova | 99.2 /100 | #89 | Exceptional $59,417 |
| Austrians | 99.2 /100 | #90 | Exceptional $59,359 |
| Laotians | 99.2 /100 | #91 | Exceptional $59,351 |
| Immigrants | Kazakhstan | 99.1 /100 | #92 | Exceptional $59,278 |
| Immigrants | Southern Europe | 99.0 /100 | #93 | Exceptional $59,217 |