Immigrants from Saudi Arabia vs Immigrants from England Median Male Earnings
COMPARE
Immigrants from Saudi Arabia
Immigrants from England
Median Male Earnings
Median Male Earnings Comparison
Immigrants from Saudi Arabia
Immigrants from England
$56,452
MEDIAN MALE EARNINGS
87.2/ 100
METRIC RATING
136th/ 347
METRIC RANK
$59,527
MEDIAN MALE EARNINGS
99.3/ 100
METRIC RATING
86th/ 347
METRIC RANK
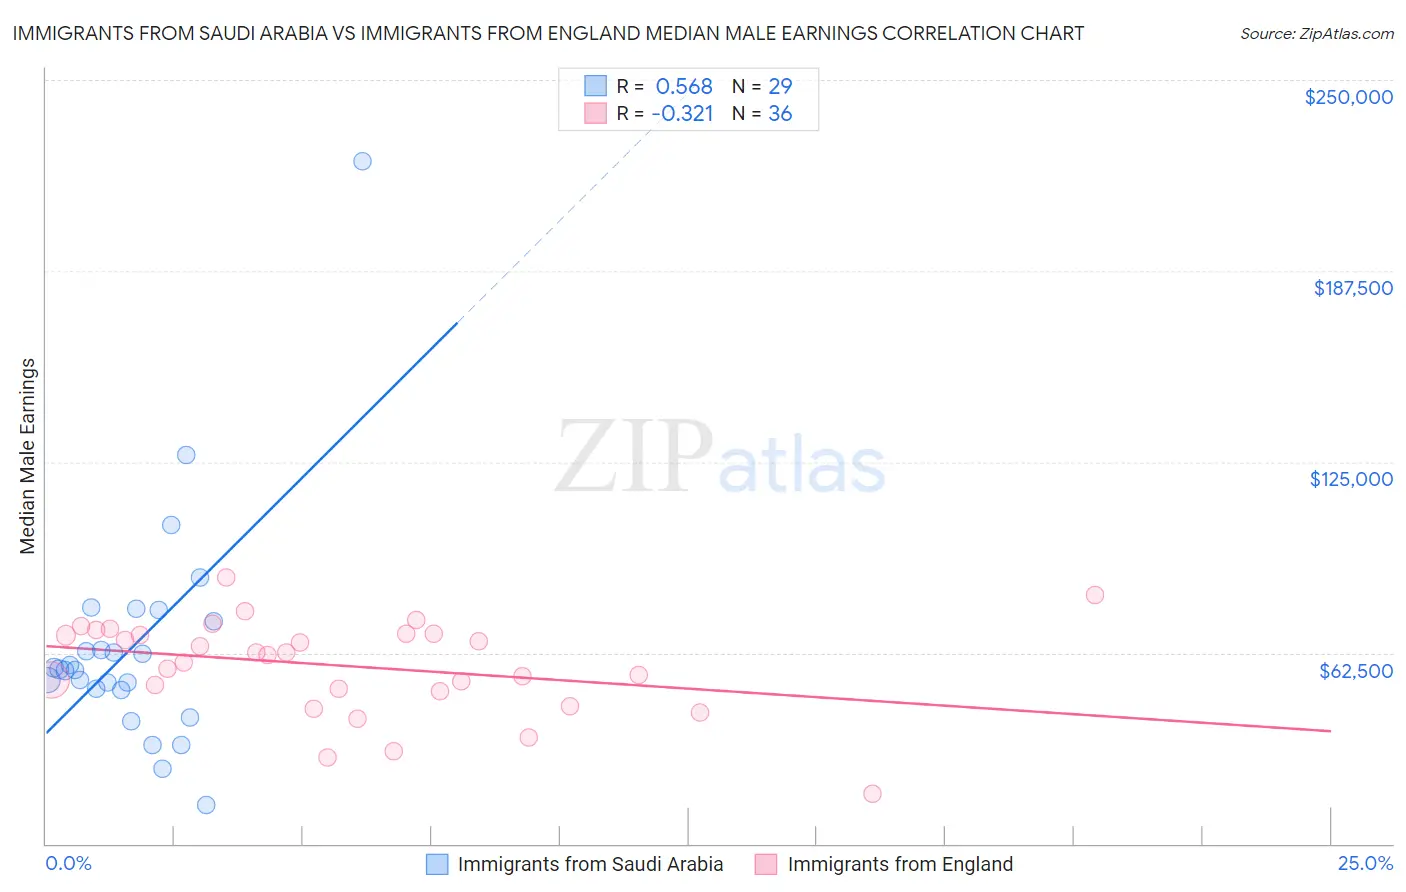
Immigrants from Saudi Arabia vs Immigrants from England Median Male Earnings Correlation Chart
The statistical analysis conducted on geographies consisting of 164,293,936 people shows a substantial positive correlation between the proportion of Immigrants from Saudi Arabia and median male earnings in the United States with a correlation coefficient (R) of 0.568 and weighted average of $56,452. Similarly, the statistical analysis conducted on geographies consisting of 391,689,688 people shows a mild negative correlation between the proportion of Immigrants from England and median male earnings in the United States with a correlation coefficient (R) of -0.321 and weighted average of $59,527, a difference of 5.4%.
Median Male Earnings Correlation Summary
| Measurement | Immigrants from Saudi Arabia | Immigrants from England |
| Minimum | $12,696 | $16,326 |
| Maximum | $223,261 | $87,186 |
| Range | $210,565 | $70,860 |
| Mean | $64,851 | $58,179 |
| Median | $57,085 | $62,084 |
| Interquartile 25% (IQ1) | $50,362 | $50,179 |
| Interquartile 75% (IQ3) | $74,807 | $68,837 |
| Interquartile Range (IQR) | $24,445 | $18,658 |
| Standard Deviation (Sample) | $38,008 | $15,499 |
| Standard Deviation (Population) | $37,347 | $15,282 |
Similar Demographics by Median Male Earnings
Demographics Similar to Immigrants from Saudi Arabia by Median Male Earnings
In terms of median male earnings, the demographic groups most similar to Immigrants from Saudi Arabia are Irish ($56,464, a difference of 0.020%), Moroccan ($56,499, a difference of 0.080%), Slavic ($56,390, a difference of 0.11%), Immigrants from Germany ($56,542, a difference of 0.16%), and Czech ($56,546, a difference of 0.17%).
| Demographics | Rating | Rank | Median Male Earnings |
| Pakistanis | 89.9 /100 | #129 | Excellent $56,719 |
| Koreans | 89.4 /100 | #130 | Excellent $56,672 |
| Portuguese | 89.4 /100 | #131 | Excellent $56,663 |
| Czechs | 88.2 /100 | #132 | Excellent $56,546 |
| Immigrants | Germany | 88.2 /100 | #133 | Excellent $56,542 |
| Moroccans | 87.7 /100 | #134 | Excellent $56,499 |
| Irish | 87.4 /100 | #135 | Excellent $56,464 |
| Immigrants | Saudi Arabia | 87.2 /100 | #136 | Excellent $56,452 |
| Slavs | 86.5 /100 | #137 | Excellent $56,390 |
| Slovaks | 85.5 /100 | #138 | Excellent $56,306 |
| Zimbabweans | 85.5 /100 | #139 | Excellent $56,302 |
| Luxembourgers | 85.5 /100 | #140 | Excellent $56,300 |
| Danes | 84.8 /100 | #141 | Excellent $56,246 |
| Ethiopians | 84.8 /100 | #142 | Excellent $56,243 |
| Sri Lankans | 83.4 /100 | #143 | Excellent $56,136 |
Demographics Similar to Immigrants from England by Median Male Earnings
In terms of median male earnings, the demographic groups most similar to Immigrants from England are Macedonian ($59,522, a difference of 0.010%), Italian ($59,551, a difference of 0.040%), Afghan ($59,554, a difference of 0.050%), Immigrants from Argentina ($59,491, a difference of 0.060%), and Immigrants from Moldova ($59,417, a difference of 0.18%).
| Demographics | Rating | Rank | Median Male Earnings |
| Immigrants | Ukraine | 99.5 /100 | #79 | Exceptional $59,820 |
| Immigrants | Hungary | 99.5 /100 | #80 | Exceptional $59,806 |
| Ukrainians | 99.4 /100 | #81 | Exceptional $59,728 |
| Croatians | 99.4 /100 | #82 | Exceptional $59,715 |
| Immigrants | Italy | 99.4 /100 | #83 | Exceptional $59,691 |
| Afghans | 99.3 /100 | #84 | Exceptional $59,554 |
| Italians | 99.3 /100 | #85 | Exceptional $59,551 |
| Immigrants | England | 99.3 /100 | #86 | Exceptional $59,527 |
| Macedonians | 99.3 /100 | #87 | Exceptional $59,522 |
| Immigrants | Argentina | 99.3 /100 | #88 | Exceptional $59,491 |
| Immigrants | Moldova | 99.2 /100 | #89 | Exceptional $59,417 |
| Austrians | 99.2 /100 | #90 | Exceptional $59,359 |
| Laotians | 99.2 /100 | #91 | Exceptional $59,351 |
| Immigrants | Kazakhstan | 99.1 /100 | #92 | Exceptional $59,278 |
| Immigrants | Southern Europe | 99.0 /100 | #93 | Exceptional $59,217 |