Lumbee vs Immigrants from England Median Male Earnings
COMPARE
Lumbee
Immigrants from England
Median Male Earnings
Median Male Earnings Comparison
Lumbee
Immigrants from England
$41,715
MEDIAN MALE EARNINGS
0.0/ 100
METRIC RATING
343rd/ 347
METRIC RANK
$59,527
MEDIAN MALE EARNINGS
99.3/ 100
METRIC RATING
86th/ 347
METRIC RANK
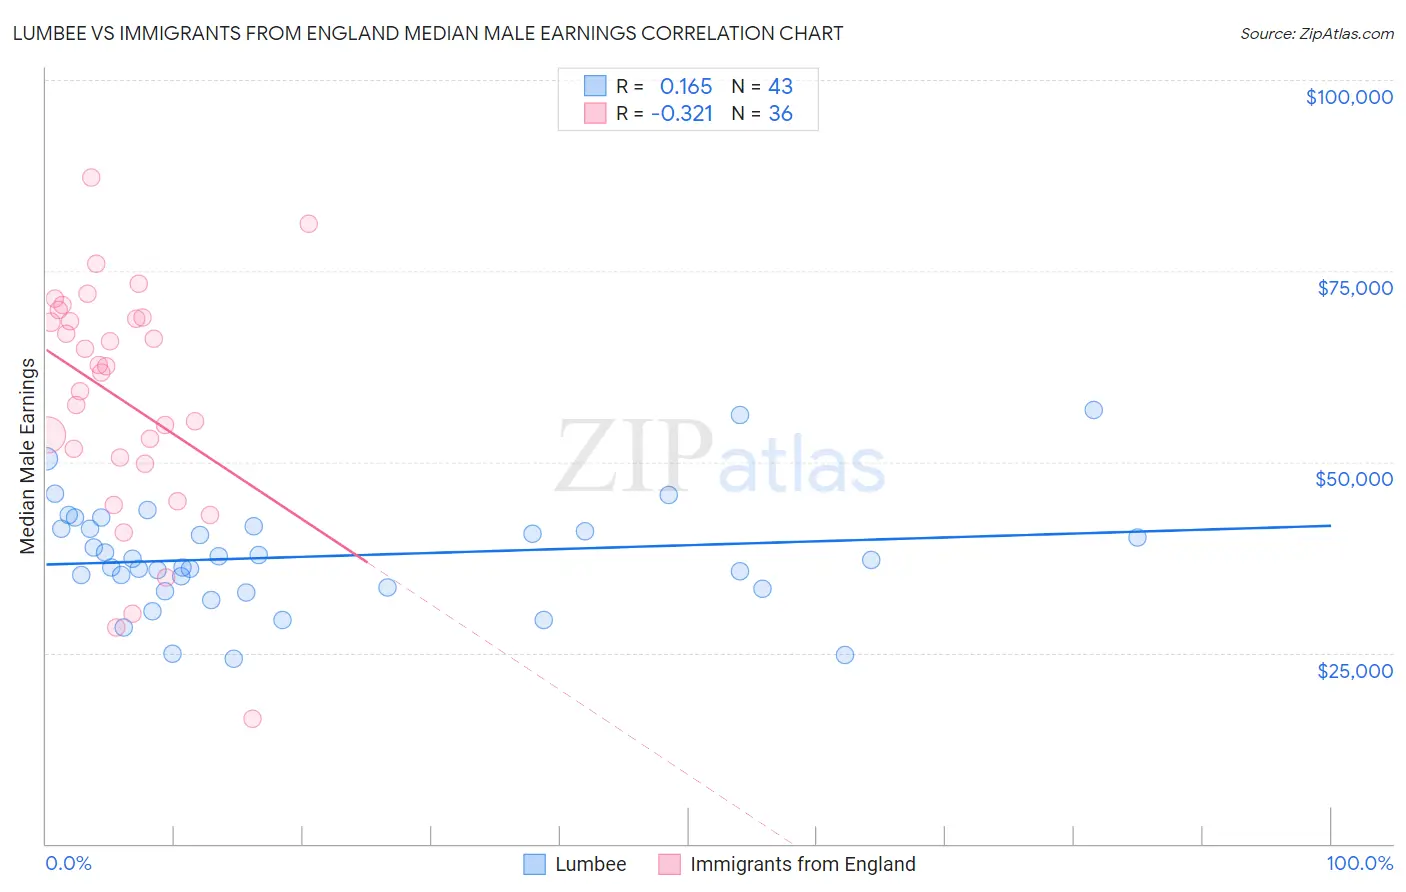
Lumbee vs Immigrants from England Median Male Earnings Correlation Chart
The statistical analysis conducted on geographies consisting of 92,276,202 people shows a poor positive correlation between the proportion of Lumbee and median male earnings in the United States with a correlation coefficient (R) of 0.165 and weighted average of $41,715. Similarly, the statistical analysis conducted on geographies consisting of 391,689,688 people shows a mild negative correlation between the proportion of Immigrants from England and median male earnings in the United States with a correlation coefficient (R) of -0.321 and weighted average of $59,527, a difference of 42.7%.
Median Male Earnings Correlation Summary
| Measurement | Lumbee | Immigrants from England |
| Minimum | $24,297 | $16,326 |
| Maximum | $56,719 | $87,186 |
| Range | $32,422 | $70,860 |
| Mean | $37,623 | $58,179 |
| Median | $37,072 | $62,084 |
| Interquartile 25% (IQ1) | $33,323 | $50,179 |
| Interquartile 75% (IQ3) | $41,323 | $68,837 |
| Interquartile Range (IQR) | $8,000 | $18,658 |
| Standard Deviation (Sample) | $7,117 | $15,499 |
| Standard Deviation (Population) | $7,034 | $15,282 |
Similar Demographics by Median Male Earnings
Demographics Similar to Lumbee by Median Male Earnings
In terms of median male earnings, the demographic groups most similar to Lumbee are Arapaho ($41,758, a difference of 0.10%), Hopi ($42,060, a difference of 0.83%), Navajo ($42,098, a difference of 0.92%), Pueblo ($41,314, a difference of 0.97%), and Pima ($42,357, a difference of 1.5%).
| Demographics | Rating | Rank | Median Male Earnings |
| Immigrants | Congo | 0.0 /100 | #333 | Tragic $44,204 |
| Immigrants | Yemen | 0.0 /100 | #334 | Tragic $44,083 |
| Spanish American Indians | 0.0 /100 | #335 | Tragic $44,010 |
| Immigrants | Cuba | 0.0 /100 | #336 | Tragic $43,461 |
| Menominee | 0.0 /100 | #337 | Tragic $42,581 |
| Crow | 0.0 /100 | #338 | Tragic $42,434 |
| Pima | 0.0 /100 | #339 | Tragic $42,357 |
| Navajo | 0.0 /100 | #340 | Tragic $42,098 |
| Hopi | 0.0 /100 | #341 | Tragic $42,060 |
| Arapaho | 0.0 /100 | #342 | Tragic $41,758 |
| Lumbee | 0.0 /100 | #343 | Tragic $41,715 |
| Pueblo | 0.0 /100 | #344 | Tragic $41,314 |
| Puerto Ricans | 0.0 /100 | #345 | Tragic $40,071 |
| Tohono O'odham | 0.0 /100 | #346 | Tragic $39,543 |
| Yup'ik | 0.0 /100 | #347 | Tragic $39,504 |
Demographics Similar to Immigrants from England by Median Male Earnings
In terms of median male earnings, the demographic groups most similar to Immigrants from England are Macedonian ($59,522, a difference of 0.010%), Italian ($59,551, a difference of 0.040%), Afghan ($59,554, a difference of 0.050%), Immigrants from Argentina ($59,491, a difference of 0.060%), and Immigrants from Moldova ($59,417, a difference of 0.18%).
| Demographics | Rating | Rank | Median Male Earnings |
| Immigrants | Ukraine | 99.5 /100 | #79 | Exceptional $59,820 |
| Immigrants | Hungary | 99.5 /100 | #80 | Exceptional $59,806 |
| Ukrainians | 99.4 /100 | #81 | Exceptional $59,728 |
| Croatians | 99.4 /100 | #82 | Exceptional $59,715 |
| Immigrants | Italy | 99.4 /100 | #83 | Exceptional $59,691 |
| Afghans | 99.3 /100 | #84 | Exceptional $59,554 |
| Italians | 99.3 /100 | #85 | Exceptional $59,551 |
| Immigrants | England | 99.3 /100 | #86 | Exceptional $59,527 |
| Macedonians | 99.3 /100 | #87 | Exceptional $59,522 |
| Immigrants | Argentina | 99.3 /100 | #88 | Exceptional $59,491 |
| Immigrants | Moldova | 99.2 /100 | #89 | Exceptional $59,417 |
| Austrians | 99.2 /100 | #90 | Exceptional $59,359 |
| Laotians | 99.2 /100 | #91 | Exceptional $59,351 |
| Immigrants | Kazakhstan | 99.1 /100 | #92 | Exceptional $59,278 |
| Immigrants | Southern Europe | 99.0 /100 | #93 | Exceptional $59,217 |