Black/African American vs Immigrants from Bolivia Median Family Income
COMPARE
Black/African American
Immigrants from Bolivia
Median Family Income
Median Family Income Comparison
Blacks/African Americans
Immigrants from Bolivia
$81,912
MEDIAN FAMILY INCOME
0.0/ 100
METRIC RATING
328th/ 347
METRIC RANK
$117,912
MEDIAN FAMILY INCOME
100.0/ 100
METRIC RATING
42nd/ 347
METRIC RANK
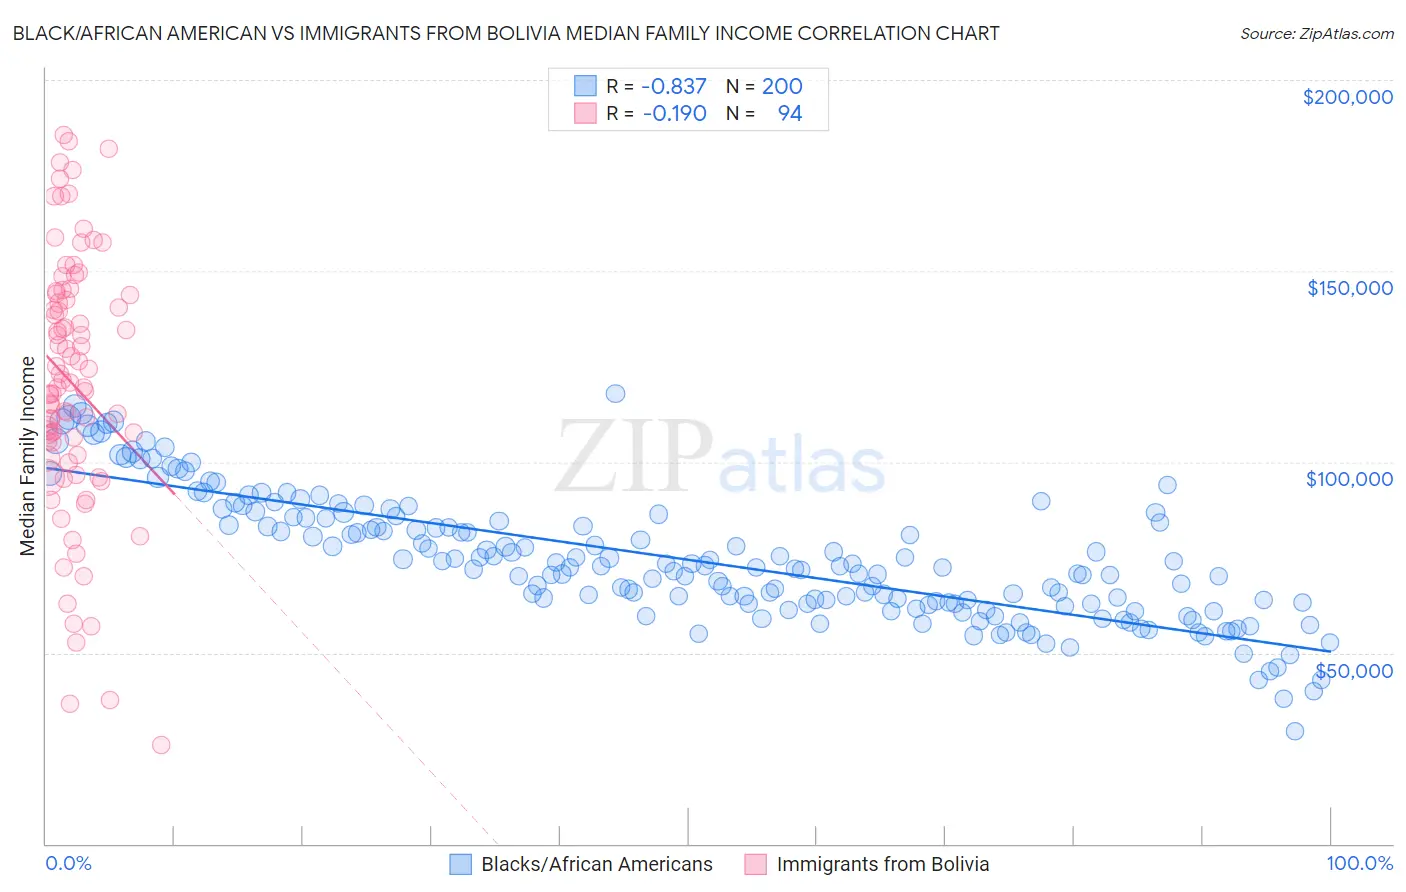
Black/African American vs Immigrants from Bolivia Median Family Income Correlation Chart
The statistical analysis conducted on geographies consisting of 564,544,060 people shows a very strong negative correlation between the proportion of Blacks/African Americans and median family income in the United States with a correlation coefficient (R) of -0.837 and weighted average of $81,912. Similarly, the statistical analysis conducted on geographies consisting of 158,713,434 people shows a poor negative correlation between the proportion of Immigrants from Bolivia and median family income in the United States with a correlation coefficient (R) of -0.190 and weighted average of $117,912, a difference of 44.0%.
Median Family Income Correlation Summary
| Measurement | Black/African American | Immigrants from Bolivia |
| Minimum | $29,315 | $25,703 |
| Maximum | $117,822 | $185,567 |
| Range | $88,507 | $159,864 |
| Mean | $74,336 | $120,434 |
| Median | $72,335 | $120,122 |
| Interquartile 25% (IQ1) | $62,832 | $101,733 |
| Interquartile 75% (IQ3) | $85,289 | $143,542 |
| Interquartile Range (IQR) | $22,457 | $41,809 |
| Standard Deviation (Sample) | $16,637 | $33,861 |
| Standard Deviation (Population) | $16,596 | $33,681 |
Similar Demographics by Median Family Income
Demographics Similar to Blacks/African Americans by Median Family Income
In terms of median family income, the demographic groups most similar to Blacks/African Americans are Dutch West Indian ($81,852, a difference of 0.070%), Arapaho ($82,064, a difference of 0.18%), Immigrants from Congo ($82,216, a difference of 0.37%), Sioux ($82,386, a difference of 0.58%), and Cheyenne ($81,385, a difference of 0.65%).
| Demographics | Rating | Rank | Median Family Income |
| Immigrants | Caribbean | 0.0 /100 | #321 | Tragic $83,319 |
| Dominicans | 0.0 /100 | #322 | Tragic $82,888 |
| Bahamians | 0.0 /100 | #323 | Tragic $82,631 |
| Creek | 0.0 /100 | #324 | Tragic $82,560 |
| Sioux | 0.0 /100 | #325 | Tragic $82,386 |
| Immigrants | Congo | 0.0 /100 | #326 | Tragic $82,216 |
| Arapaho | 0.0 /100 | #327 | Tragic $82,064 |
| Blacks/African Americans | 0.0 /100 | #328 | Tragic $81,912 |
| Dutch West Indians | 0.0 /100 | #329 | Tragic $81,852 |
| Cheyenne | 0.0 /100 | #330 | Tragic $81,385 |
| Immigrants | Dominican Republic | 0.0 /100 | #331 | Tragic $81,233 |
| Natives/Alaskans | 0.0 /100 | #332 | Tragic $80,908 |
| Kiowa | 0.0 /100 | #333 | Tragic $80,885 |
| Menominee | 0.0 /100 | #334 | Tragic $79,563 |
| Yup'ik | 0.0 /100 | #335 | Tragic $79,290 |
Demographics Similar to Immigrants from Bolivia by Median Family Income
In terms of median family income, the demographic groups most similar to Immigrants from Bolivia are Bulgarian ($117,818, a difference of 0.080%), Estonian ($118,013, a difference of 0.090%), Cambodian ($117,780, a difference of 0.11%), Immigrants from Lithuania ($118,053, a difference of 0.12%), and Immigrants from Asia ($118,291, a difference of 0.32%).
| Demographics | Rating | Rank | Median Family Income |
| Soviet Union | 100.0 /100 | #35 | Exceptional $119,262 |
| Israelis | 100.0 /100 | #36 | Exceptional $118,577 |
| Australians | 100.0 /100 | #37 | Exceptional $118,440 |
| Immigrants | Turkey | 100.0 /100 | #38 | Exceptional $118,325 |
| Immigrants | Asia | 100.0 /100 | #39 | Exceptional $118,291 |
| Immigrants | Lithuania | 100.0 /100 | #40 | Exceptional $118,053 |
| Estonians | 100.0 /100 | #41 | Exceptional $118,013 |
| Immigrants | Bolivia | 100.0 /100 | #42 | Exceptional $117,912 |
| Bulgarians | 100.0 /100 | #43 | Exceptional $117,818 |
| Cambodians | 100.0 /100 | #44 | Exceptional $117,780 |
| Immigrants | Greece | 99.9 /100 | #45 | Exceptional $117,344 |
| Immigrants | Russia | 99.9 /100 | #46 | Exceptional $116,942 |
| Immigrants | Austria | 99.9 /100 | #47 | Exceptional $116,830 |
| Immigrants | South Africa | 99.9 /100 | #48 | Exceptional $116,286 |
| Chinese | 99.9 /100 | #49 | Exceptional $116,188 |