American vs Immigrants from Belize Median Male Earnings
COMPARE
American
Immigrants from Belize
Median Male Earnings
Median Male Earnings Comparison
Americans
Immigrants from Belize
$50,761
MEDIAN MALE EARNINGS
2.5/ 100
METRIC RATING
239th/ 347
METRIC RANK
$47,809
MEDIAN MALE EARNINGS
0.1/ 100
METRIC RATING
290th/ 347
METRIC RANK
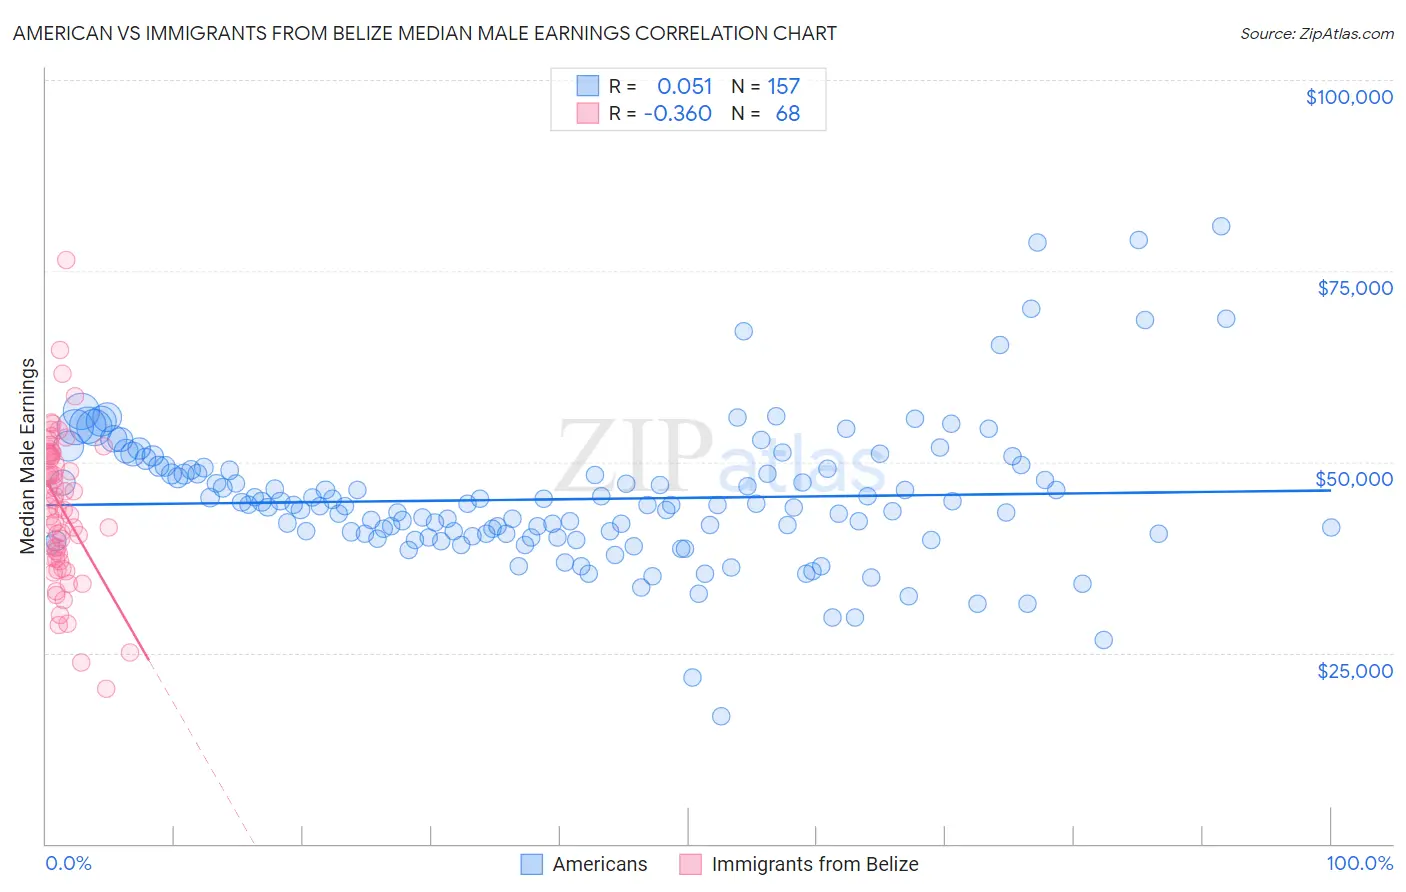
American vs Immigrants from Belize Median Male Earnings Correlation Chart
The statistical analysis conducted on geographies consisting of 580,042,530 people shows a slight positive correlation between the proportion of Americans and median male earnings in the United States with a correlation coefficient (R) of 0.051 and weighted average of $50,761. Similarly, the statistical analysis conducted on geographies consisting of 130,305,697 people shows a mild negative correlation between the proportion of Immigrants from Belize and median male earnings in the United States with a correlation coefficient (R) of -0.360 and weighted average of $47,809, a difference of 6.2%.
Median Male Earnings Correlation Summary
| Measurement | American | Immigrants from Belize |
| Minimum | $16,756 | $20,292 |
| Maximum | $80,855 | $76,469 |
| Range | $64,099 | $56,177 |
| Mean | $45,104 | $44,004 |
| Median | $44,329 | $43,946 |
| Interquartile 25% (IQ1) | $40,142 | $37,392 |
| Interquartile 75% (IQ3) | $48,927 | $51,048 |
| Interquartile Range (IQR) | $8,785 | $13,656 |
| Standard Deviation (Sample) | $9,213 | $9,886 |
| Standard Deviation (Population) | $9,183 | $9,813 |
Similar Demographics by Median Male Earnings
Demographics Similar to Americans by Median Male Earnings
In terms of median male earnings, the demographic groups most similar to Americans are Malaysian ($50,772, a difference of 0.020%), Immigrants from Barbados ($50,795, a difference of 0.070%), West Indian ($50,682, a difference of 0.16%), Immigrants from St. Vincent and the Grenadines ($50,665, a difference of 0.19%), and Pennsylvania German ($50,878, a difference of 0.23%).
| Demographics | Rating | Rank | Median Male Earnings |
| Sudanese | 3.9 /100 | #232 | Tragic $51,216 |
| Aleuts | 3.7 /100 | #233 | Tragic $51,168 |
| Cape Verdeans | 3.5 /100 | #234 | Tragic $51,103 |
| Immigrants | Western Africa | 3.0 /100 | #235 | Tragic $50,940 |
| Pennsylvania Germans | 2.8 /100 | #236 | Tragic $50,878 |
| Immigrants | Barbados | 2.6 /100 | #237 | Tragic $50,795 |
| Malaysians | 2.5 /100 | #238 | Tragic $50,772 |
| Americans | 2.5 /100 | #239 | Tragic $50,761 |
| West Indians | 2.3 /100 | #240 | Tragic $50,682 |
| Immigrants | St. Vincent and the Grenadines | 2.3 /100 | #241 | Tragic $50,665 |
| Guyanese | 2.2 /100 | #242 | Tragic $50,613 |
| French American Indians | 2.2 /100 | #243 | Tragic $50,611 |
| Houma | 2.0 /100 | #244 | Tragic $50,547 |
| Hawaiians | 1.9 /100 | #245 | Tragic $50,488 |
| Immigrants | Ecuador | 1.9 /100 | #246 | Tragic $50,474 |
Demographics Similar to Immigrants from Belize by Median Male Earnings
In terms of median male earnings, the demographic groups most similar to Immigrants from Belize are Chickasaw ($47,832, a difference of 0.050%), Choctaw ($47,729, a difference of 0.17%), Shoshone ($47,930, a difference of 0.25%), Immigrants from Dominica ($47,651, a difference of 0.33%), and Immigrants from El Salvador ($47,973, a difference of 0.34%).
| Demographics | Rating | Rank | Median Male Earnings |
| Immigrants | Jamaica | 0.2 /100 | #283 | Tragic $48,040 |
| Africans | 0.2 /100 | #284 | Tragic $47,994 |
| Paiute | 0.2 /100 | #285 | Tragic $47,991 |
| Mexican American Indians | 0.2 /100 | #286 | Tragic $47,990 |
| Immigrants | El Salvador | 0.2 /100 | #287 | Tragic $47,973 |
| Shoshone | 0.2 /100 | #288 | Tragic $47,930 |
| Chickasaw | 0.1 /100 | #289 | Tragic $47,832 |
| Immigrants | Belize | 0.1 /100 | #290 | Tragic $47,809 |
| Choctaw | 0.1 /100 | #291 | Tragic $47,729 |
| Immigrants | Dominica | 0.1 /100 | #292 | Tragic $47,651 |
| Indonesians | 0.1 /100 | #293 | Tragic $47,503 |
| Immigrants | Nicaragua | 0.1 /100 | #294 | Tragic $47,482 |
| Central American Indians | 0.1 /100 | #295 | Tragic $47,433 |
| Inupiat | 0.1 /100 | #296 | Tragic $47,281 |
| Dominicans | 0.1 /100 | #297 | Tragic $47,204 |