Immigrants from South America vs Immigrants from Belize Median Male Earnings
COMPARE
Immigrants from South America
Immigrants from Belize
Median Male Earnings
Median Male Earnings Comparison
Immigrants from South America
Immigrants from Belize
$53,962
MEDIAN MALE EARNINGS
37.3/ 100
METRIC RATING
183rd/ 347
METRIC RANK
$47,809
MEDIAN MALE EARNINGS
0.1/ 100
METRIC RATING
290th/ 347
METRIC RANK
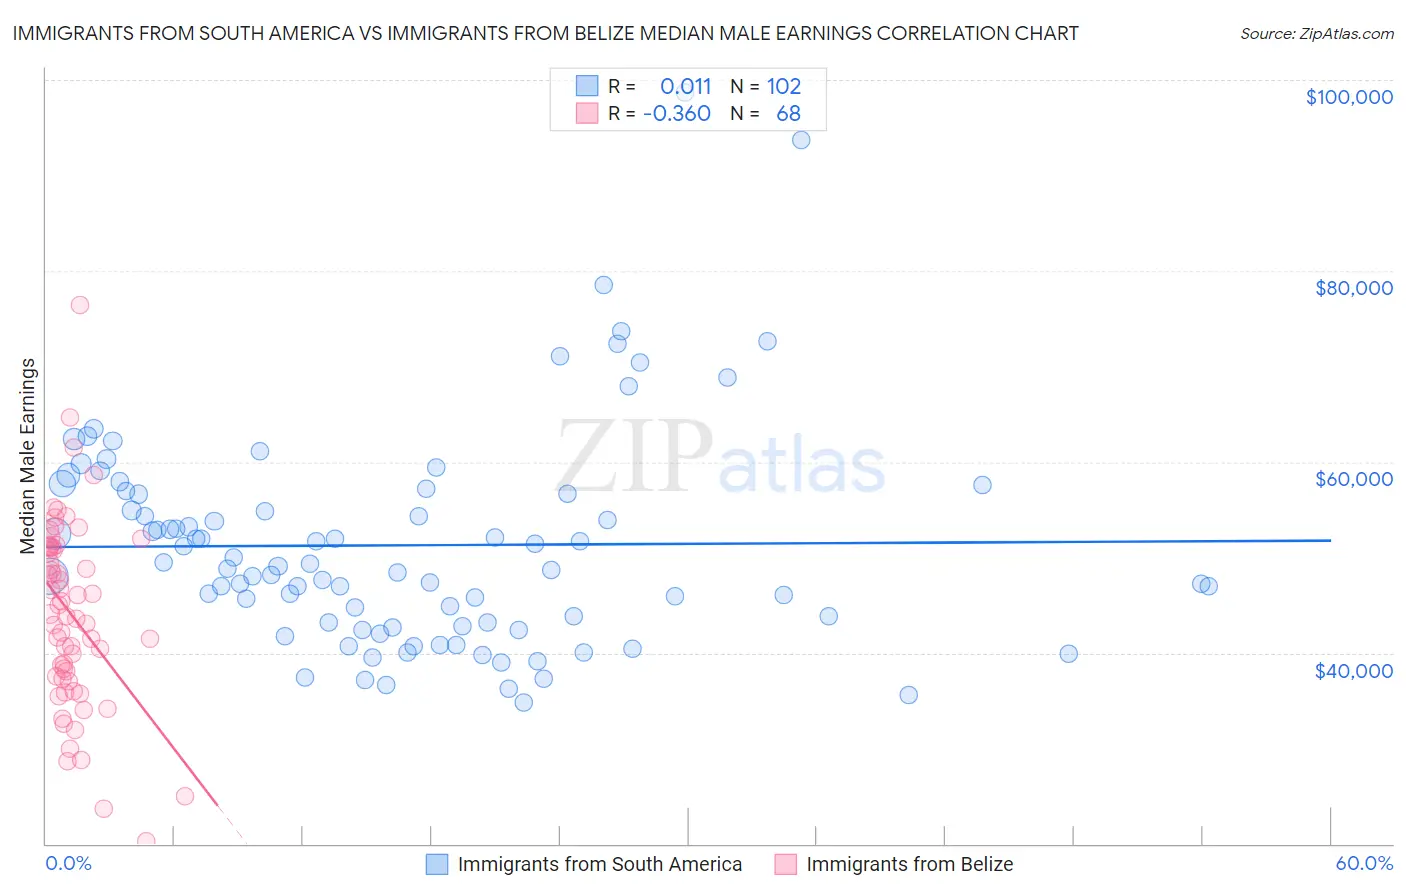
Immigrants from South America vs Immigrants from Belize Median Male Earnings Correlation Chart
The statistical analysis conducted on geographies consisting of 486,116,321 people shows no correlation between the proportion of Immigrants from South America and median male earnings in the United States with a correlation coefficient (R) of 0.011 and weighted average of $53,962. Similarly, the statistical analysis conducted on geographies consisting of 130,305,697 people shows a mild negative correlation between the proportion of Immigrants from Belize and median male earnings in the United States with a correlation coefficient (R) of -0.360 and weighted average of $47,809, a difference of 12.9%.
Median Male Earnings Correlation Summary
| Measurement | Immigrants from South America | Immigrants from Belize |
| Minimum | $34,825 | $20,292 |
| Maximum | $98,656 | $76,469 |
| Range | $63,831 | $56,177 |
| Mean | $51,267 | $44,004 |
| Median | $48,941 | $43,946 |
| Interquartile 25% (IQ1) | $43,131 | $37,392 |
| Interquartile 75% (IQ3) | $56,719 | $51,048 |
| Interquartile Range (IQR) | $13,589 | $13,656 |
| Standard Deviation (Sample) | $11,368 | $9,886 |
| Standard Deviation (Population) | $11,312 | $9,813 |
Similar Demographics by Median Male Earnings
Demographics Similar to Immigrants from South America by Median Male Earnings
In terms of median male earnings, the demographic groups most similar to Immigrants from South America are Yugoslavian ($53,967, a difference of 0.010%), White/Caucasian ($53,925, a difference of 0.070%), Immigrants from Sierra Leone ($53,905, a difference of 0.11%), Colombian ($53,832, a difference of 0.24%), and Immigrants ($54,168, a difference of 0.38%).
| Demographics | Rating | Rank | Median Male Earnings |
| Spaniards | 47.8 /100 | #176 | Average $54,401 |
| Costa Ricans | 44.8 /100 | #177 | Average $54,279 |
| Sierra Leoneans | 44.8 /100 | #178 | Average $54,279 |
| Celtics | 43.9 /100 | #179 | Average $54,242 |
| Iraqis | 42.5 /100 | #180 | Average $54,182 |
| Immigrants | Immigrants | 42.1 /100 | #181 | Average $54,168 |
| Yugoslavians | 37.4 /100 | #182 | Fair $53,967 |
| Immigrants | South America | 37.3 /100 | #183 | Fair $53,962 |
| Whites/Caucasians | 36.5 /100 | #184 | Fair $53,925 |
| Immigrants | Sierra Leone | 36.0 /100 | #185 | Fair $53,905 |
| Colombians | 34.4 /100 | #186 | Fair $53,832 |
| Immigrants | Eritrea | 31.8 /100 | #187 | Fair $53,715 |
| Immigrants | Eastern Africa | 31.8 /100 | #188 | Fair $53,713 |
| Puget Sound Salish | 31.6 /100 | #189 | Fair $53,704 |
| Uruguayans | 31.1 /100 | #190 | Fair $53,680 |
Demographics Similar to Immigrants from Belize by Median Male Earnings
In terms of median male earnings, the demographic groups most similar to Immigrants from Belize are Chickasaw ($47,832, a difference of 0.050%), Choctaw ($47,729, a difference of 0.17%), Shoshone ($47,930, a difference of 0.25%), Immigrants from Dominica ($47,651, a difference of 0.33%), and Immigrants from El Salvador ($47,973, a difference of 0.34%).
| Demographics | Rating | Rank | Median Male Earnings |
| Immigrants | Jamaica | 0.2 /100 | #283 | Tragic $48,040 |
| Africans | 0.2 /100 | #284 | Tragic $47,994 |
| Paiute | 0.2 /100 | #285 | Tragic $47,991 |
| Mexican American Indians | 0.2 /100 | #286 | Tragic $47,990 |
| Immigrants | El Salvador | 0.2 /100 | #287 | Tragic $47,973 |
| Shoshone | 0.2 /100 | #288 | Tragic $47,930 |
| Chickasaw | 0.1 /100 | #289 | Tragic $47,832 |
| Immigrants | Belize | 0.1 /100 | #290 | Tragic $47,809 |
| Choctaw | 0.1 /100 | #291 | Tragic $47,729 |
| Immigrants | Dominica | 0.1 /100 | #292 | Tragic $47,651 |
| Indonesians | 0.1 /100 | #293 | Tragic $47,503 |
| Immigrants | Nicaragua | 0.1 /100 | #294 | Tragic $47,482 |
| Central American Indians | 0.1 /100 | #295 | Tragic $47,433 |
| Inupiat | 0.1 /100 | #296 | Tragic $47,281 |
| Dominicans | 0.1 /100 | #297 | Tragic $47,204 |