Immigrants from Belize vs Cambodian Householder Income Under 25 years
COMPARE
Immigrants from Belize
Cambodian
Householder Income Under 25 years
Householder Income Under 25 years Comparison
Immigrants from Belize
Cambodians
$51,223
HOUSEHOLDER INCOME UNDER 25 YEARS
8.6/ 100
METRIC RATING
218th/ 347
METRIC RANK
$55,571
HOUSEHOLDER INCOME UNDER 25 YEARS
100.0/ 100
METRIC RATING
47th/ 347
METRIC RANK
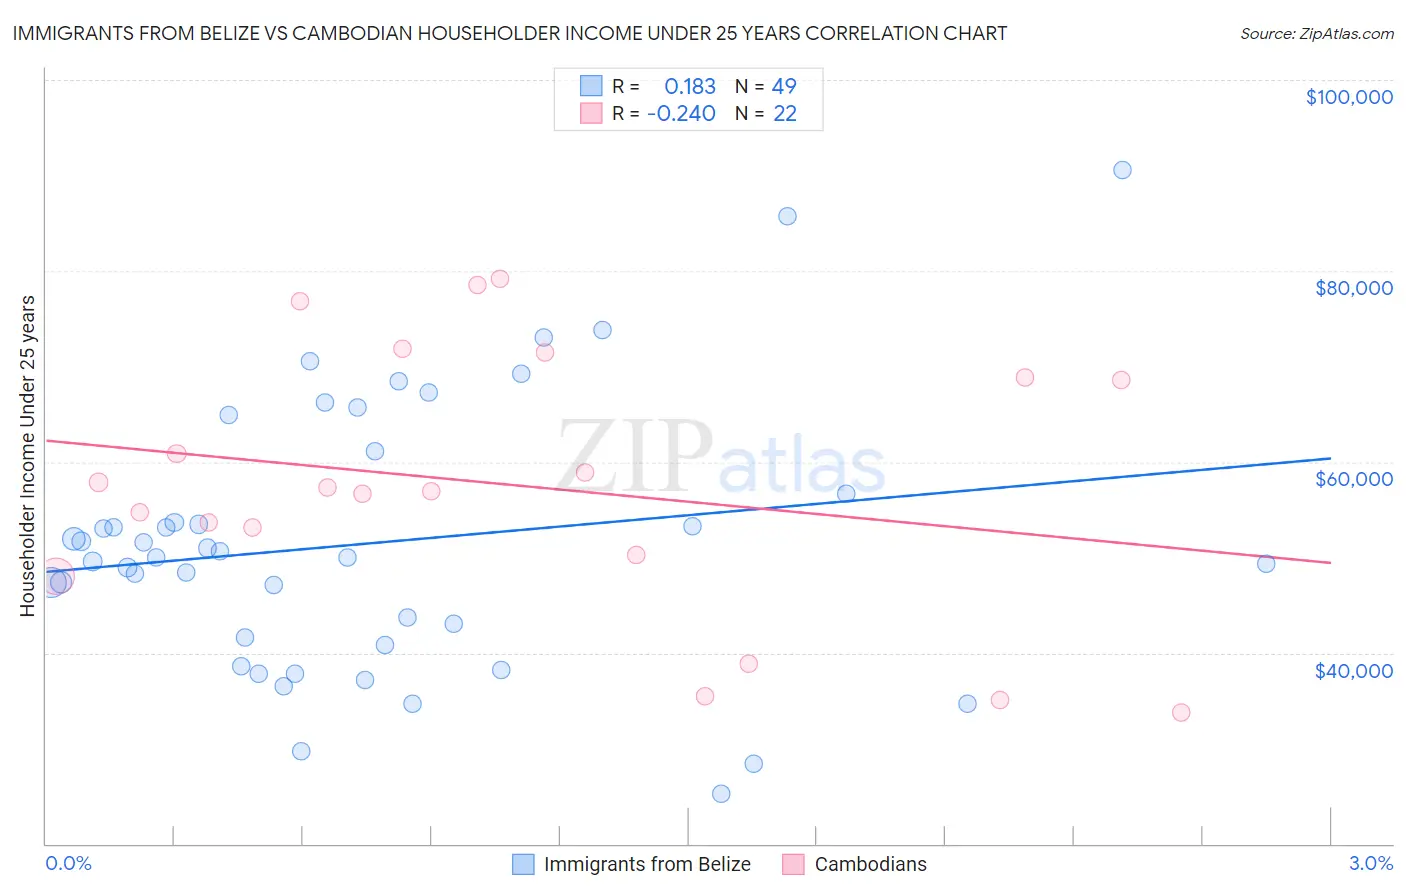
Immigrants from Belize vs Cambodian Householder Income Under 25 years Correlation Chart
The statistical analysis conducted on geographies consisting of 120,196,234 people shows a poor positive correlation between the proportion of Immigrants from Belize and household income with householder under the age of 25 in the United States with a correlation coefficient (R) of 0.183 and weighted average of $51,223. Similarly, the statistical analysis conducted on geographies consisting of 96,374,158 people shows a weak negative correlation between the proportion of Cambodians and household income with householder under the age of 25 in the United States with a correlation coefficient (R) of -0.240 and weighted average of $55,571, a difference of 8.5%.
Householder Income Under 25 years Correlation Summary
| Measurement | Immigrants from Belize | Cambodian |
| Minimum | $25,260 | $33,698 |
| Maximum | $90,540 | $79,145 |
| Range | $65,280 | $45,447 |
| Mean | $51,503 | $57,571 |
| Median | $50,002 | $57,095 |
| Interquartile 25% (IQ1) | $41,202 | $50,277 |
| Interquartile 75% (IQ3) | $58,923 | $68,894 |
| Interquartile Range (IQR) | $17,721 | $18,617 |
| Standard Deviation (Sample) | $14,040 | $13,871 |
| Standard Deviation (Population) | $13,896 | $13,553 |
Similar Demographics by Householder Income Under 25 years
Demographics Similar to Immigrants from Belize by Householder Income Under 25 years
In terms of householder income under 25 years, the demographic groups most similar to Immigrants from Belize are Czechoslovakian ($51,224, a difference of 0.0%), French ($51,230, a difference of 0.010%), Arab ($51,219, a difference of 0.010%), Icelander ($51,247, a difference of 0.050%), and Immigrants from Germany ($51,190, a difference of 0.060%).
| Demographics | Rating | Rank | Householder Income Under 25 years |
| Irish | 10.6 /100 | #211 | Poor $51,317 |
| Immigrants | Panama | 9.7 /100 | #212 | Tragic $51,278 |
| Dutch | 9.4 /100 | #213 | Tragic $51,265 |
| Zimbabweans | 9.3 /100 | #214 | Tragic $51,259 |
| Icelanders | 9.1 /100 | #215 | Tragic $51,247 |
| French | 8.7 /100 | #216 | Tragic $51,230 |
| Czechoslovakians | 8.6 /100 | #217 | Tragic $51,224 |
| Immigrants | Belize | 8.6 /100 | #218 | Tragic $51,223 |
| Arabs | 8.5 /100 | #219 | Tragic $51,219 |
| Immigrants | Germany | 8.0 /100 | #220 | Tragic $51,190 |
| Immigrants | Eastern Africa | 7.4 /100 | #221 | Tragic $51,158 |
| Spaniards | 6.8 /100 | #222 | Tragic $51,117 |
| Serbians | 6.6 /100 | #223 | Tragic $51,106 |
| Belizeans | 6.4 /100 | #224 | Tragic $51,094 |
| Immigrants | Jamaica | 5.6 /100 | #225 | Tragic $51,038 |
Demographics Similar to Cambodians by Householder Income Under 25 years
In terms of householder income under 25 years, the demographic groups most similar to Cambodians are Spanish American Indian ($55,573, a difference of 0.0%), Immigrants from Eastern Europe ($55,572, a difference of 0.0%), Immigrants from Vietnam ($55,562, a difference of 0.020%), Iranian ($55,548, a difference of 0.040%), and Puget Sound Salish ($55,543, a difference of 0.050%).
| Demographics | Rating | Rank | Householder Income Under 25 years |
| Immigrants | Greece | 100.0 /100 | #40 | Exceptional $55,727 |
| Immigrants | Guyana | 100.0 /100 | #41 | Exceptional $55,726 |
| Immigrants | Korea | 100.0 /100 | #42 | Exceptional $55,716 |
| Immigrants | South Eastern Asia | 100.0 /100 | #43 | Exceptional $55,714 |
| Paraguayans | 100.0 /100 | #44 | Exceptional $55,614 |
| Spanish American Indians | 100.0 /100 | #45 | Exceptional $55,573 |
| Immigrants | Eastern Europe | 100.0 /100 | #46 | Exceptional $55,572 |
| Cambodians | 100.0 /100 | #47 | Exceptional $55,571 |
| Immigrants | Vietnam | 100.0 /100 | #48 | Exceptional $55,562 |
| Iranians | 100.0 /100 | #49 | Exceptional $55,548 |
| Puget Sound Salish | 100.0 /100 | #50 | Exceptional $55,543 |
| Immigrants | Romania | 100.0 /100 | #51 | Exceptional $55,522 |
| Immigrants | Indonesia | 100.0 /100 | #52 | Exceptional $55,521 |
| Immigrants | Poland | 100.0 /100 | #53 | Exceptional $55,474 |
| Sri Lankans | 100.0 /100 | #54 | Exceptional $55,470 |