Ethiopian vs Immigrants from Moldova Per Capita Income
COMPARE
Ethiopian
Immigrants from Moldova
Per Capita Income
Per Capita Income Comparison
Ethiopians
Immigrants from Moldova
$46,569
PER CAPITA INCOME
96.3/ 100
METRIC RATING
106th/ 347
METRIC RANK
$47,489
PER CAPITA INCOME
98.7/ 100
METRIC RATING
92nd/ 347
METRIC RANK
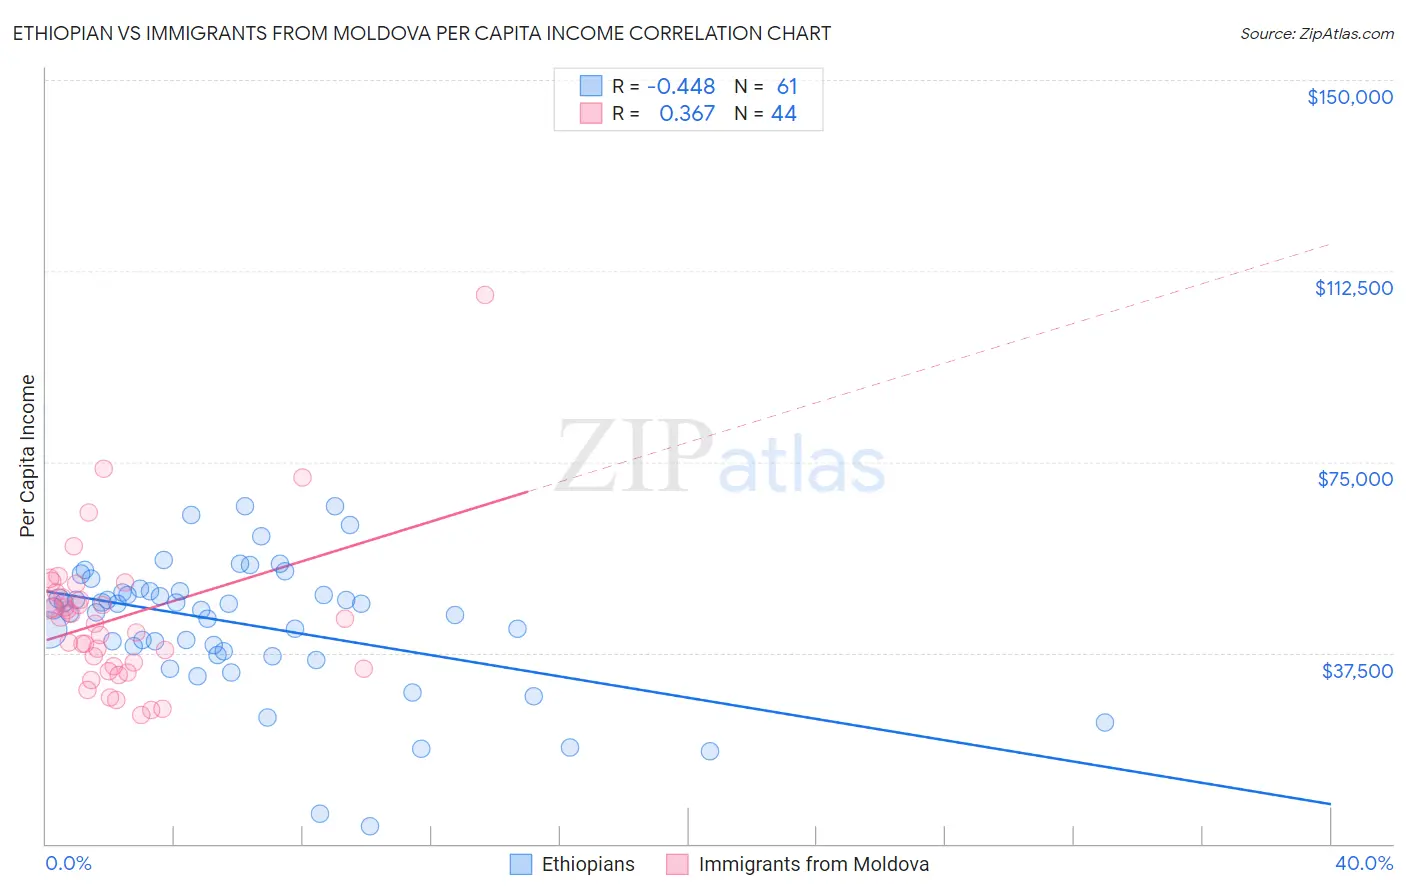
Ethiopian vs Immigrants from Moldova Per Capita Income Correlation Chart
The statistical analysis conducted on geographies consisting of 223,280,317 people shows a moderate negative correlation between the proportion of Ethiopians and per capita income in the United States with a correlation coefficient (R) of -0.448 and weighted average of $46,569. Similarly, the statistical analysis conducted on geographies consisting of 124,402,409 people shows a mild positive correlation between the proportion of Immigrants from Moldova and per capita income in the United States with a correlation coefficient (R) of 0.367 and weighted average of $47,489, a difference of 2.0%.
Per Capita Income Correlation Summary
| Measurement | Ethiopian | Immigrants from Moldova |
| Minimum | $3,511 | $25,195 |
| Maximum | $66,352 | $107,889 |
| Range | $62,841 | $82,694 |
| Mean | $43,114 | $44,404 |
| Median | $46,234 | $43,721 |
| Interquartile 25% (IQ1) | $37,442 | $34,656 |
| Interquartile 75% (IQ3) | $49,561 | $48,923 |
| Interquartile Range (IQR) | $12,119 | $14,267 |
| Standard Deviation (Sample) | $12,938 | $14,744 |
| Standard Deviation (Population) | $12,832 | $14,575 |
Demographics Similar to Ethiopians and Immigrants from Moldova by Per Capita Income
In terms of per capita income, the demographic groups most similar to Ethiopians are British ($46,571, a difference of 0.0%), Serbian ($46,551, a difference of 0.040%), Immigrants from Kuwait ($46,543, a difference of 0.060%), Immigrants from Northern Africa ($46,531, a difference of 0.080%), and Brazilian ($46,700, a difference of 0.28%). Similarly, the demographic groups most similar to Immigrants from Moldova are Italian ($47,574, a difference of 0.18%), Macedonian ($47,573, a difference of 0.18%), Immigrants from Zimbabwe ($47,394, a difference of 0.20%), Albanian ($47,379, a difference of 0.23%), and Immigrants from Egypt ($47,361, a difference of 0.27%).
| Demographics | Rating | Rank | Per Capita Income |
| Northern Europeans | 98.9 /100 | #89 | Exceptional $47,698 |
| Italians | 98.8 /100 | #90 | Exceptional $47,574 |
| Macedonians | 98.8 /100 | #91 | Exceptional $47,573 |
| Immigrants | Moldova | 98.7 /100 | #92 | Exceptional $47,489 |
| Immigrants | Zimbabwe | 98.5 /100 | #93 | Exceptional $47,394 |
| Albanians | 98.5 /100 | #94 | Exceptional $47,379 |
| Immigrants | Egypt | 98.5 /100 | #95 | Exceptional $47,361 |
| Alsatians | 98.3 /100 | #96 | Exceptional $47,284 |
| Carpatho Rusyns | 98.2 /100 | #97 | Exceptional $47,248 |
| Immigrants | Pakistan | 97.9 /100 | #98 | Exceptional $47,084 |
| Laotians | 97.8 /100 | #99 | Exceptional $47,041 |
| Immigrants | Lebanon | 97.5 /100 | #100 | Exceptional $46,938 |
| Immigrants | Uzbekistan | 97.5 /100 | #101 | Exceptional $46,929 |
| Immigrants | Western Asia | 97.4 /100 | #102 | Exceptional $46,876 |
| Syrians | 97.2 /100 | #103 | Exceptional $46,837 |
| Brazilians | 96.8 /100 | #104 | Exceptional $46,700 |
| British | 96.3 /100 | #105 | Exceptional $46,571 |
| Ethiopians | 96.3 /100 | #106 | Exceptional $46,569 |
| Serbians | 96.2 /100 | #107 | Exceptional $46,551 |
| Immigrants | Kuwait | 96.2 /100 | #108 | Exceptional $46,543 |
| Immigrants | Northern Africa | 96.2 /100 | #109 | Exceptional $46,531 |