Immigrants from Latin America vs Immigrants from Moldova Per Capita Income
COMPARE
Immigrants from Latin America
Immigrants from Moldova
Per Capita Income
Per Capita Income Comparison
Immigrants from Latin America
Immigrants from Moldova
$36,823
PER CAPITA INCOME
0.0/ 100
METRIC RATING
307th/ 347
METRIC RANK
$47,489
PER CAPITA INCOME
98.7/ 100
METRIC RATING
92nd/ 347
METRIC RANK
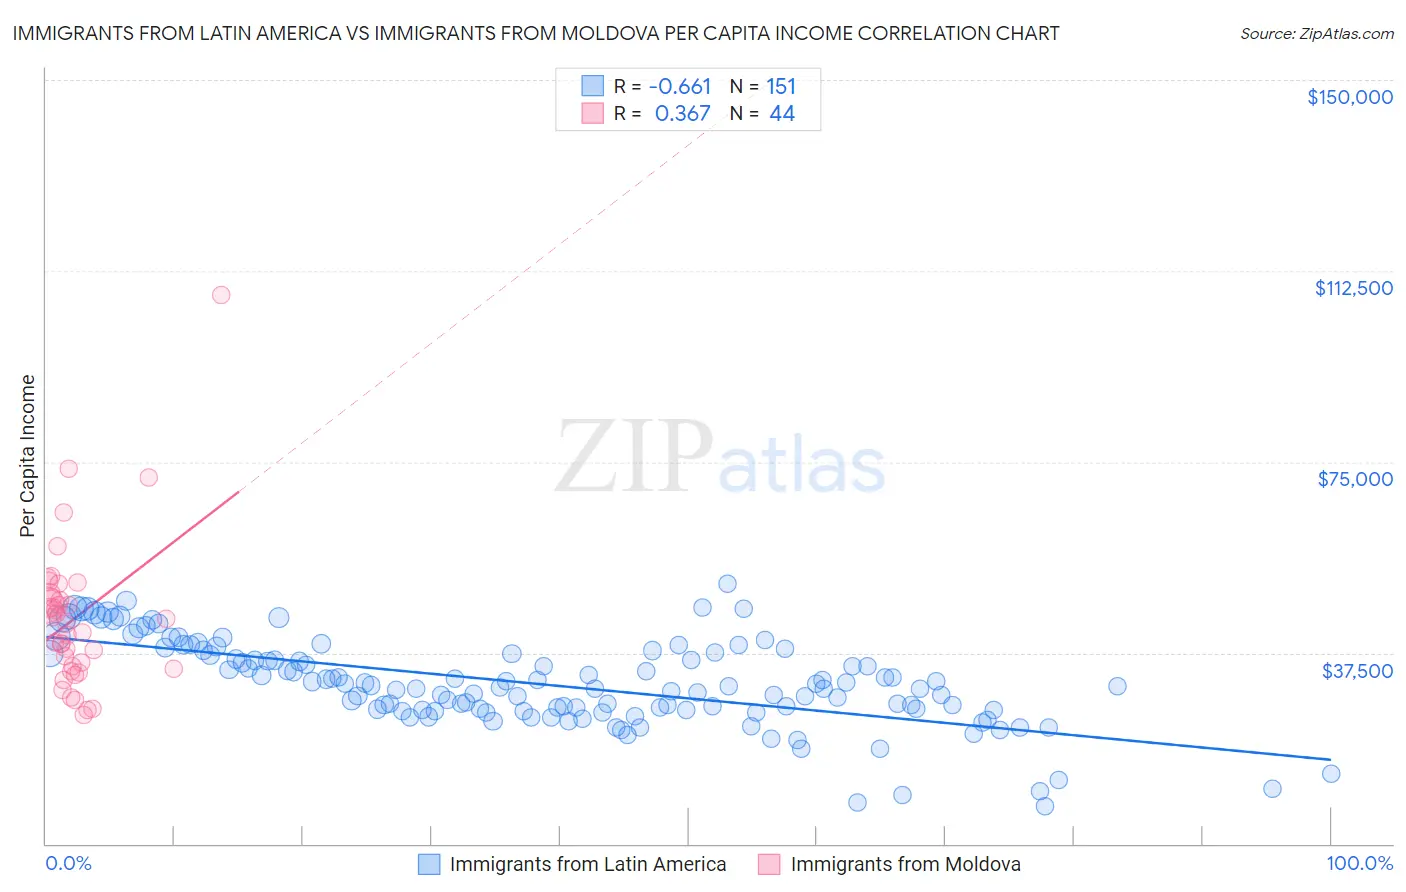
Immigrants from Latin America vs Immigrants from Moldova Per Capita Income Correlation Chart
The statistical analysis conducted on geographies consisting of 558,689,902 people shows a significant negative correlation between the proportion of Immigrants from Latin America and per capita income in the United States with a correlation coefficient (R) of -0.661 and weighted average of $36,823. Similarly, the statistical analysis conducted on geographies consisting of 124,402,409 people shows a mild positive correlation between the proportion of Immigrants from Moldova and per capita income in the United States with a correlation coefficient (R) of 0.367 and weighted average of $47,489, a difference of 29.0%.
Per Capita Income Correlation Summary
| Measurement | Immigrants from Latin America | Immigrants from Moldova |
| Minimum | $7,365 | $25,195 |
| Maximum | $51,138 | $107,889 |
| Range | $43,773 | $82,694 |
| Mean | $31,346 | $44,404 |
| Median | $30,830 | $43,721 |
| Interquartile 25% (IQ1) | $26,256 | $34,656 |
| Interquartile 75% (IQ3) | $37,351 | $48,923 |
| Interquartile Range (IQR) | $11,095 | $14,267 |
| Standard Deviation (Sample) | $8,475 | $14,744 |
| Standard Deviation (Population) | $8,446 | $14,575 |
Similar Demographics by Per Capita Income
Demographics Similar to Immigrants from Latin America by Per Capita Income
In terms of per capita income, the demographic groups most similar to Immigrants from Latin America are Immigrants from Haiti ($36,849, a difference of 0.070%), Fijian ($36,690, a difference of 0.36%), Immigrants from Honduras ($36,665, a difference of 0.43%), Ute ($36,651, a difference of 0.47%), and Inupiat ($36,999, a difference of 0.48%).
| Demographics | Rating | Rank | Per Capita Income |
| Immigrants | Bahamas | 0.1 /100 | #300 | Tragic $37,193 |
| Ottawa | 0.1 /100 | #301 | Tragic $37,101 |
| Shoshone | 0.1 /100 | #302 | Tragic $37,072 |
| Paiute | 0.1 /100 | #303 | Tragic $37,066 |
| Hondurans | 0.1 /100 | #304 | Tragic $37,031 |
| Inupiat | 0.1 /100 | #305 | Tragic $36,999 |
| Immigrants | Haiti | 0.0 /100 | #306 | Tragic $36,849 |
| Immigrants | Latin America | 0.0 /100 | #307 | Tragic $36,823 |
| Fijians | 0.0 /100 | #308 | Tragic $36,690 |
| Immigrants | Honduras | 0.0 /100 | #309 | Tragic $36,665 |
| Ute | 0.0 /100 | #310 | Tragic $36,651 |
| Chippewa | 0.0 /100 | #311 | Tragic $36,631 |
| Chickasaw | 0.0 /100 | #312 | Tragic $36,475 |
| Bahamians | 0.0 /100 | #313 | Tragic $36,427 |
| Seminole | 0.0 /100 | #314 | Tragic $36,180 |
Demographics Similar to Immigrants from Moldova by Per Capita Income
In terms of per capita income, the demographic groups most similar to Immigrants from Moldova are Italian ($47,574, a difference of 0.18%), Macedonian ($47,573, a difference of 0.18%), Immigrants from Zimbabwe ($47,394, a difference of 0.20%), Albanian ($47,379, a difference of 0.23%), and Immigrants from Egypt ($47,361, a difference of 0.27%).
| Demographics | Rating | Rank | Per Capita Income |
| Austrians | 99.3 /100 | #85 | Exceptional $48,116 |
| Immigrants | Southern Europe | 99.3 /100 | #86 | Exceptional $48,027 |
| Ukrainians | 99.3 /100 | #87 | Exceptional $48,014 |
| Croatians | 99.0 /100 | #88 | Exceptional $47,742 |
| Northern Europeans | 98.9 /100 | #89 | Exceptional $47,698 |
| Italians | 98.8 /100 | #90 | Exceptional $47,574 |
| Macedonians | 98.8 /100 | #91 | Exceptional $47,573 |
| Immigrants | Moldova | 98.7 /100 | #92 | Exceptional $47,489 |
| Immigrants | Zimbabwe | 98.5 /100 | #93 | Exceptional $47,394 |
| Albanians | 98.5 /100 | #94 | Exceptional $47,379 |
| Immigrants | Egypt | 98.5 /100 | #95 | Exceptional $47,361 |
| Alsatians | 98.3 /100 | #96 | Exceptional $47,284 |
| Carpatho Rusyns | 98.2 /100 | #97 | Exceptional $47,248 |
| Immigrants | Pakistan | 97.9 /100 | #98 | Exceptional $47,084 |
| Laotians | 97.8 /100 | #99 | Exceptional $47,041 |