Blackfeet vs Immigrants from Jordan Disability Age 65 to 74
COMPARE
Blackfeet
Immigrants from Jordan
Disability Age 65 to 74
Disability Age 65 to 74 Comparison
Blackfeet
Immigrants from Jordan
26.6%
DISABILITY AGE 65 TO 74
0.0/ 100
METRIC RATING
292nd/ 347
METRIC RANK
22.4%
DISABILITY AGE 65 TO 74
93.5/ 100
METRIC RATING
122nd/ 347
METRIC RANK
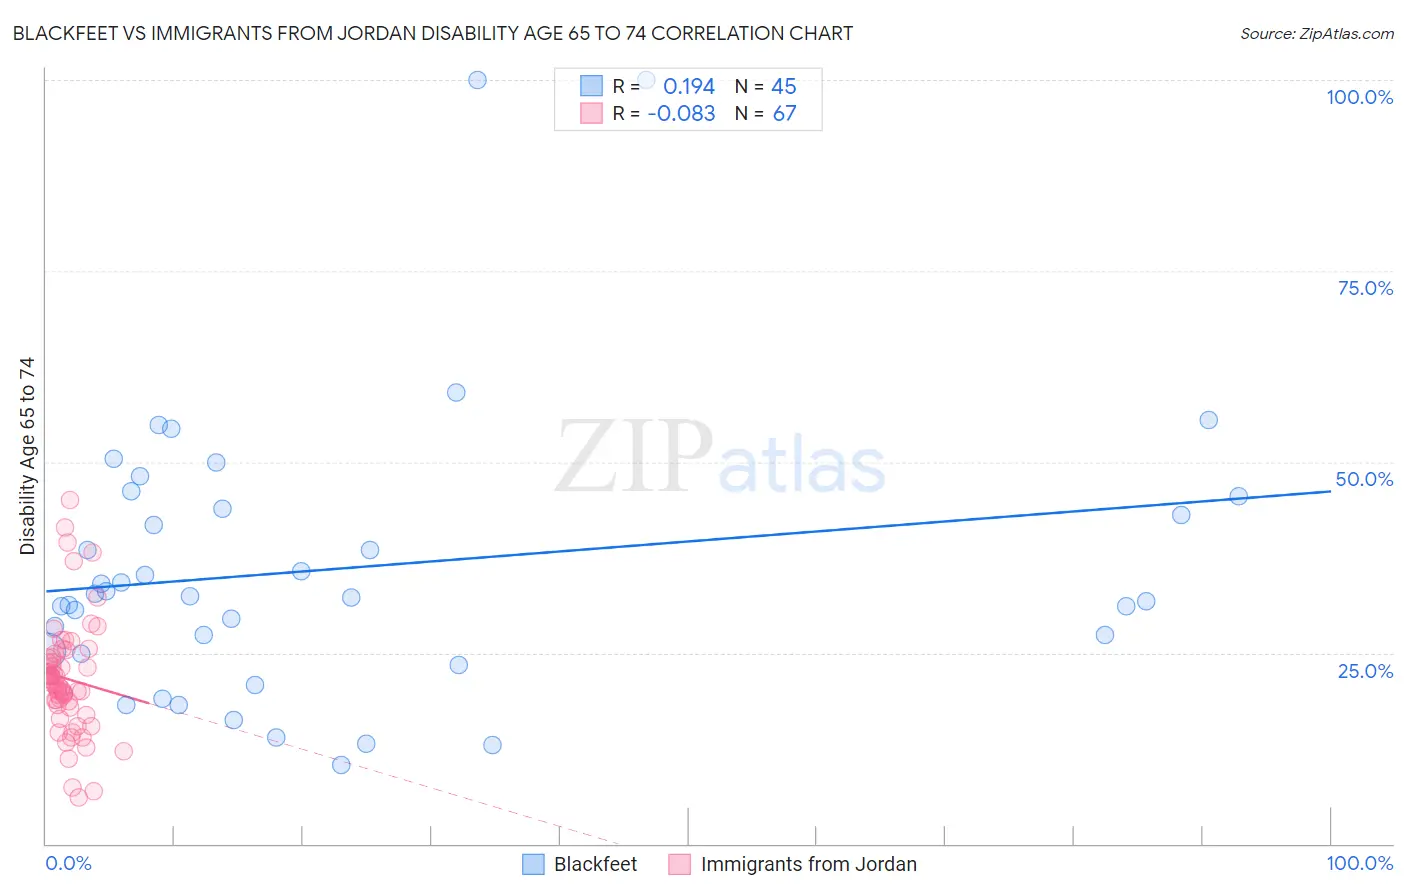
Blackfeet vs Immigrants from Jordan Disability Age 65 to 74 Correlation Chart
The statistical analysis conducted on geographies consisting of 309,087,362 people shows a poor positive correlation between the proportion of Blackfeet and percentage of population with a disability between the ages 65 and 75 in the United States with a correlation coefficient (R) of 0.194 and weighted average of 26.6%. Similarly, the statistical analysis conducted on geographies consisting of 181,155,276 people shows a slight negative correlation between the proportion of Immigrants from Jordan and percentage of population with a disability between the ages 65 and 75 in the United States with a correlation coefficient (R) of -0.083 and weighted average of 22.4%, a difference of 18.6%.
Disability Age 65 to 74 Correlation Summary
| Measurement | Blackfeet | Immigrants from Jordan |
| Minimum | 10.2% | 6.1% |
| Maximum | 100.0% | 44.9% |
| Range | 89.8% | 38.8% |
| Mean | 36.1% | 21.6% |
| Median | 32.3% | 21.1% |
| Interquartile 25% (IQ1) | 25.1% | 18.1% |
| Interquartile 75% (IQ3) | 44.6% | 24.4% |
| Interquartile Range (IQR) | 19.6% | 6.3% |
| Standard Deviation (Sample) | 18.6% | 7.4% |
| Standard Deviation (Population) | 18.4% | 7.4% |
Similar Demographics by Disability Age 65 to 74
Demographics Similar to Blackfeet by Disability Age 65 to 74
In terms of disability age 65 to 74, the demographic groups most similar to Blackfeet are Immigrants from Central America (26.6%, a difference of 0.16%), Dominican (26.7%, a difference of 0.28%), Hispanic or Latino (26.7%, a difference of 0.30%), Spanish American Indian (26.4%, a difference of 0.88%), and Bangladeshi (26.8%, a difference of 0.91%).
| Demographics | Rating | Rank | Disability Age 65 to 74 |
| Immigrants | Congo | 0.0 /100 | #285 | Tragic 26.0% |
| Immigrants | Micronesia | 0.0 /100 | #286 | Tragic 26.1% |
| Immigrants | Laos | 0.0 /100 | #287 | Tragic 26.1% |
| Mexican American Indians | 0.0 /100 | #288 | Tragic 26.2% |
| Africans | 0.0 /100 | #289 | Tragic 26.2% |
| Immigrants | Cabo Verde | 0.0 /100 | #290 | Tragic 26.3% |
| Spanish American Indians | 0.0 /100 | #291 | Tragic 26.4% |
| Blackfeet | 0.0 /100 | #292 | Tragic 26.6% |
| Immigrants | Central America | 0.0 /100 | #293 | Tragic 26.6% |
| Dominicans | 0.0 /100 | #294 | Tragic 26.7% |
| Hispanics or Latinos | 0.0 /100 | #295 | Tragic 26.7% |
| Bangladeshis | 0.0 /100 | #296 | Tragic 26.8% |
| Fijians | 0.0 /100 | #297 | Tragic 27.0% |
| Immigrants | Yemen | 0.0 /100 | #298 | Tragic 27.0% |
| Potawatomi | 0.0 /100 | #299 | Tragic 27.0% |
Demographics Similar to Immigrants from Jordan by Disability Age 65 to 74
In terms of disability age 65 to 74, the demographic groups most similar to Immigrants from Jordan are Czech (22.4%, a difference of 0.0%), Hungarian (22.4%, a difference of 0.050%), Immigrants from Kazakhstan (22.4%, a difference of 0.10%), Norwegian (22.5%, a difference of 0.24%), and Immigrants from Western Europe (22.5%, a difference of 0.28%).
| Demographics | Rating | Rank | Disability Age 65 to 74 |
| Laotians | 94.9 /100 | #115 | Exceptional 22.3% |
| Brazilians | 94.8 /100 | #116 | Exceptional 22.4% |
| Swedes | 94.7 /100 | #117 | Exceptional 22.4% |
| Austrians | 94.7 /100 | #118 | Exceptional 22.4% |
| Immigrants | Northern Africa | 94.7 /100 | #119 | Exceptional 22.4% |
| Immigrants | Kazakhstan | 93.9 /100 | #120 | Exceptional 22.4% |
| Czechs | 93.5 /100 | #121 | Exceptional 22.4% |
| Immigrants | Jordan | 93.5 /100 | #122 | Exceptional 22.4% |
| Hungarians | 93.3 /100 | #123 | Exceptional 22.4% |
| Norwegians | 92.5 /100 | #124 | Exceptional 22.5% |
| Immigrants | Western Europe | 92.3 /100 | #125 | Exceptional 22.5% |
| Lebanese | 92.2 /100 | #126 | Exceptional 22.5% |
| Slovaks | 91.6 /100 | #127 | Exceptional 22.5% |
| Immigrants | Costa Rica | 90.4 /100 | #128 | Exceptional 22.6% |
| Immigrants | Uruguay | 90.1 /100 | #129 | Exceptional 22.6% |