Spanish American Indian vs Immigrants from Hong Kong Median Earnings
COMPARE
Spanish American Indian
Immigrants from Hong Kong
Median Earnings
Median Earnings Comparison
Spanish American Indians
Immigrants from Hong Kong
$38,907
MEDIAN EARNINGS
0.0/ 100
METRIC RATING
334th/ 347
METRIC RANK
$59,433
MEDIAN EARNINGS
100.0/ 100
METRIC RATING
4th/ 347
METRIC RANK
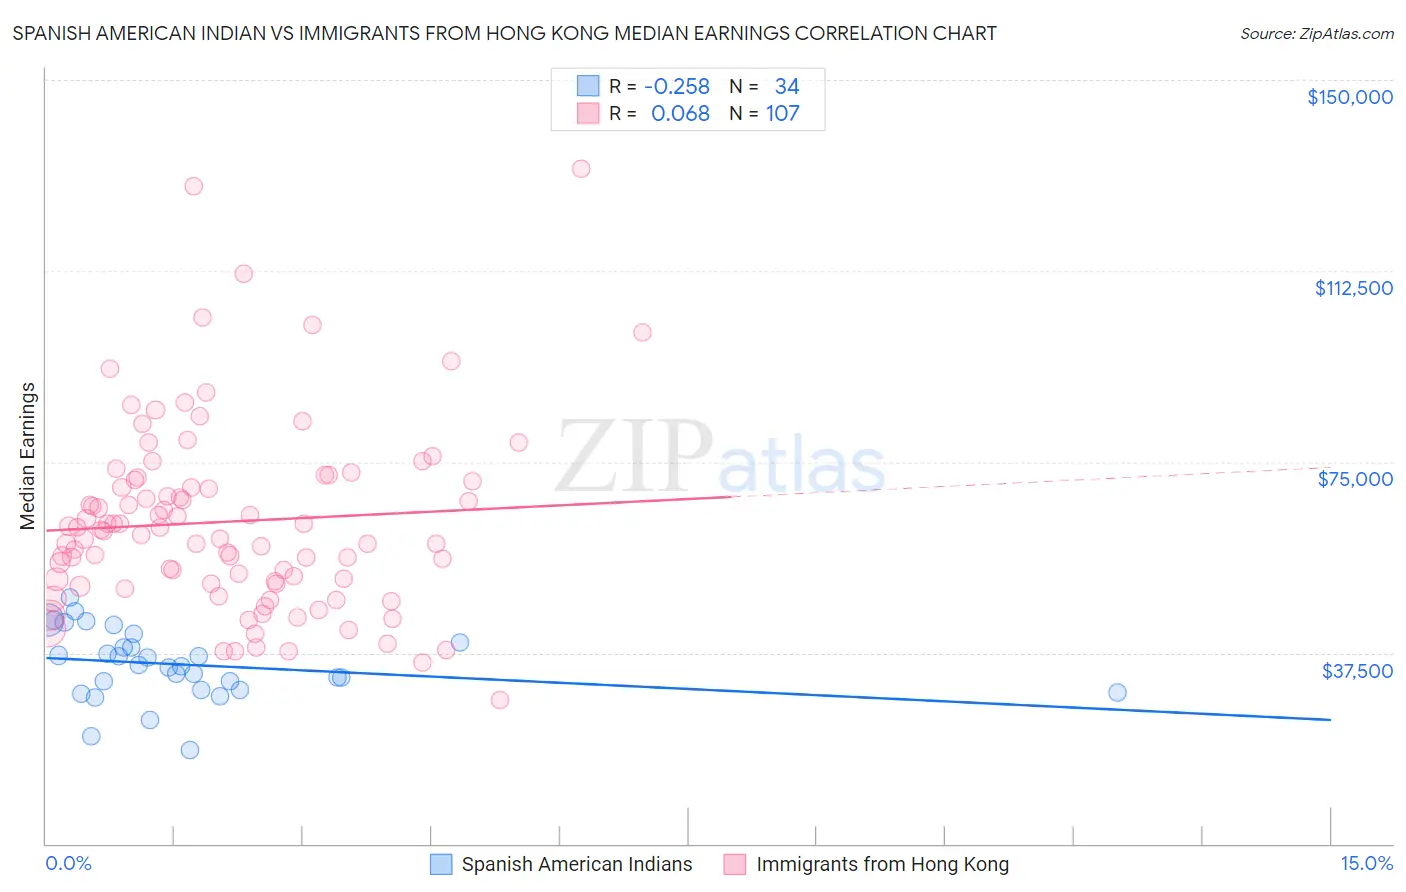
Spanish American Indian vs Immigrants from Hong Kong Median Earnings Correlation Chart
The statistical analysis conducted on geographies consisting of 73,148,786 people shows a weak negative correlation between the proportion of Spanish American Indians and median earnings in the United States with a correlation coefficient (R) of -0.258 and weighted average of $38,907. Similarly, the statistical analysis conducted on geographies consisting of 253,960,155 people shows a slight positive correlation between the proportion of Immigrants from Hong Kong and median earnings in the United States with a correlation coefficient (R) of 0.068 and weighted average of $59,433, a difference of 52.8%.
Median Earnings Correlation Summary
| Measurement | Spanish American Indian | Immigrants from Hong Kong |
| Minimum | $18,469 | $28,125 |
| Maximum | $48,281 | $132,614 |
| Range | $29,812 | $104,489 |
| Mean | $35,173 | $63,267 |
| Median | $34,974 | $61,404 |
| Interquartile 25% (IQ1) | $30,208 | $51,159 |
| Interquartile 75% (IQ3) | $39,452 | $71,509 |
| Interquartile Range (IQR) | $9,244 | $20,350 |
| Standard Deviation (Sample) | $6,885 | $18,453 |
| Standard Deviation (Population) | $6,783 | $18,367 |
Similar Demographics by Median Earnings
Demographics Similar to Spanish American Indians by Median Earnings
In terms of median earnings, the demographic groups most similar to Spanish American Indians are Native/Alaskan ($38,896, a difference of 0.030%), Houma ($38,949, a difference of 0.11%), Yakama ($39,107, a difference of 0.52%), Crow ($38,707, a difference of 0.52%), and Immigrants from Mexico ($39,114, a difference of 0.53%).
| Demographics | Rating | Rank | Median Earnings |
| Yuman | 0.0 /100 | #327 | Tragic $39,523 |
| Sioux | 0.0 /100 | #328 | Tragic $39,448 |
| Kiowa | 0.0 /100 | #329 | Tragic $39,232 |
| Immigrants | Congo | 0.0 /100 | #330 | Tragic $39,169 |
| Immigrants | Mexico | 0.0 /100 | #331 | Tragic $39,114 |
| Yakama | 0.0 /100 | #332 | Tragic $39,107 |
| Houma | 0.0 /100 | #333 | Tragic $38,949 |
| Spanish American Indians | 0.0 /100 | #334 | Tragic $38,907 |
| Natives/Alaskans | 0.0 /100 | #335 | Tragic $38,896 |
| Crow | 0.0 /100 | #336 | Tragic $38,707 |
| Immigrants | Cuba | 0.0 /100 | #337 | Tragic $38,426 |
| Pima | 0.0 /100 | #338 | Tragic $38,285 |
| Menominee | 0.0 /100 | #339 | Tragic $37,884 |
| Navajo | 0.0 /100 | #340 | Tragic $36,999 |
| Lumbee | 0.0 /100 | #341 | Tragic $36,876 |
Demographics Similar to Immigrants from Hong Kong by Median Earnings
In terms of median earnings, the demographic groups most similar to Immigrants from Hong Kong are Thai ($59,237, a difference of 0.33%), Immigrants from Singapore ($59,038, a difference of 0.67%), Iranian ($58,474, a difference of 1.6%), Immigrants from India ($60,648, a difference of 2.0%), and Immigrants from Taiwan ($61,151, a difference of 2.9%).
| Demographics | Rating | Rank | Median Earnings |
| Filipinos | 100.0 /100 | #1 | Exceptional $61,197 |
| Immigrants | Taiwan | 100.0 /100 | #2 | Exceptional $61,151 |
| Immigrants | India | 100.0 /100 | #3 | Exceptional $60,648 |
| Immigrants | Hong Kong | 100.0 /100 | #4 | Exceptional $59,433 |
| Thais | 100.0 /100 | #5 | Exceptional $59,237 |
| Immigrants | Singapore | 100.0 /100 | #6 | Exceptional $59,038 |
| Iranians | 100.0 /100 | #7 | Exceptional $58,474 |
| Immigrants | Iran | 100.0 /100 | #8 | Exceptional $57,612 |
| Okinawans | 100.0 /100 | #9 | Exceptional $57,550 |
| Immigrants | South Central Asia | 100.0 /100 | #10 | Exceptional $57,114 |
| Immigrants | Israel | 100.0 /100 | #11 | Exceptional $57,034 |
| Immigrants | Ireland | 100.0 /100 | #12 | Exceptional $56,854 |
| Immigrants | China | 100.0 /100 | #13 | Exceptional $56,638 |
| Immigrants | Australia | 100.0 /100 | #14 | Exceptional $56,305 |
| Indians (Asian) | 100.0 /100 | #15 | Exceptional $56,253 |