Malaysian vs Immigrants from Hong Kong Median Earnings
COMPARE
Malaysian
Immigrants from Hong Kong
Median Earnings
Median Earnings Comparison
Malaysians
Immigrants from Hong Kong
$43,844
MEDIAN EARNINGS
2.6/ 100
METRIC RATING
249th/ 347
METRIC RANK
$59,433
MEDIAN EARNINGS
100.0/ 100
METRIC RATING
4th/ 347
METRIC RANK
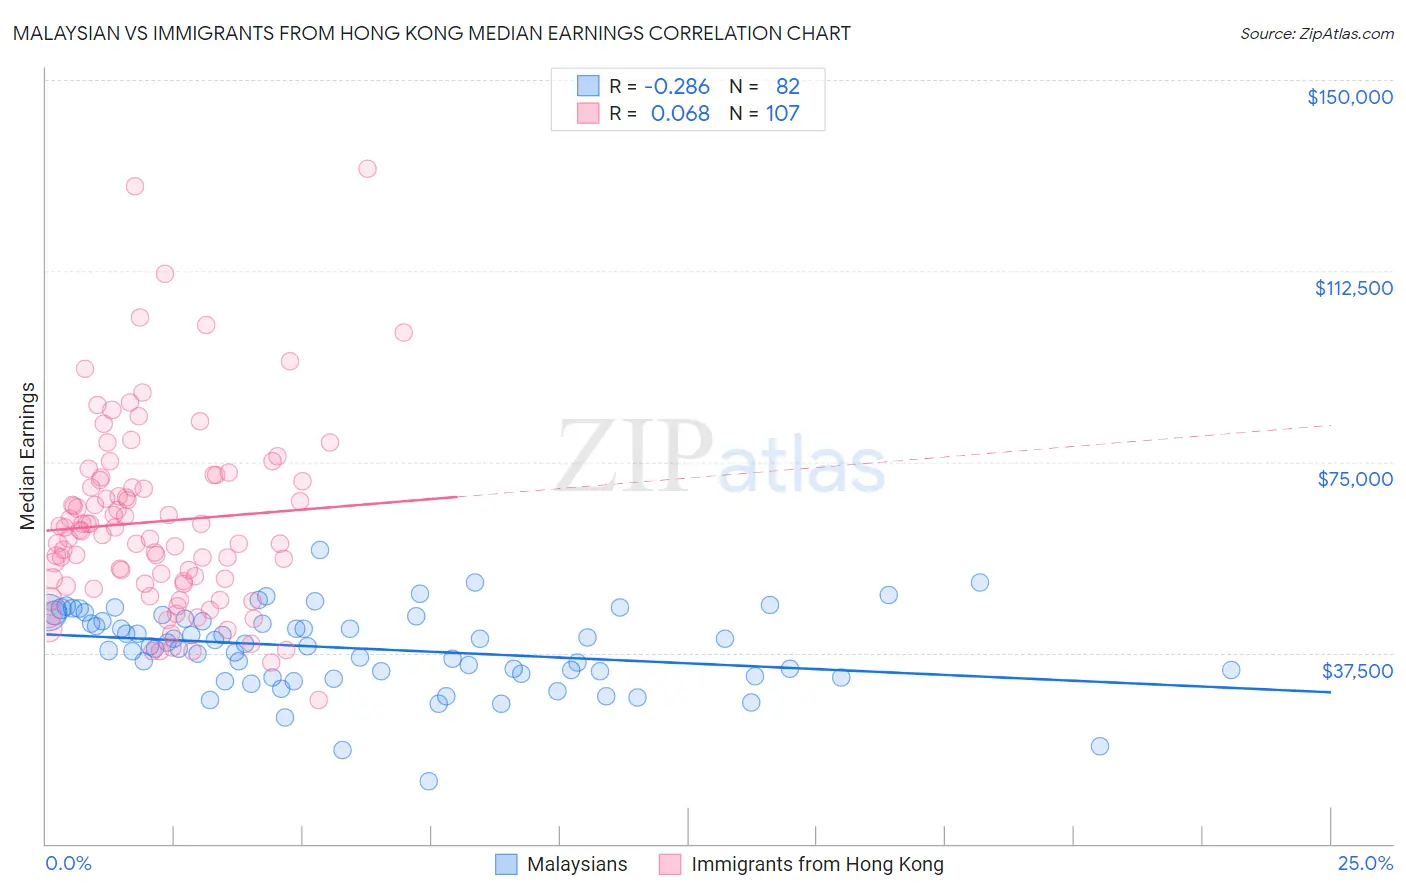
Malaysian vs Immigrants from Hong Kong Median Earnings Correlation Chart
The statistical analysis conducted on geographies consisting of 226,109,286 people shows a weak negative correlation between the proportion of Malaysians and median earnings in the United States with a correlation coefficient (R) of -0.286 and weighted average of $43,844. Similarly, the statistical analysis conducted on geographies consisting of 253,960,155 people shows a slight positive correlation between the proportion of Immigrants from Hong Kong and median earnings in the United States with a correlation coefficient (R) of 0.068 and weighted average of $59,433, a difference of 35.6%.
Median Earnings Correlation Summary
| Measurement | Malaysian | Immigrants from Hong Kong |
| Minimum | $12,196 | $28,125 |
| Maximum | $57,662 | $132,614 |
| Range | $45,466 | $104,489 |
| Mean | $38,334 | $63,267 |
| Median | $39,047 | $61,404 |
| Interquartile 25% (IQ1) | $33,295 | $51,159 |
| Interquartile 75% (IQ3) | $44,277 | $71,509 |
| Interquartile Range (IQR) | $10,982 | $20,350 |
| Standard Deviation (Sample) | $7,931 | $18,453 |
| Standard Deviation (Population) | $7,883 | $18,367 |
Similar Demographics by Median Earnings
Demographics Similar to Malaysians by Median Earnings
In terms of median earnings, the demographic groups most similar to Malaysians are Nepalese ($43,860, a difference of 0.040%), Alaska Native ($43,750, a difference of 0.22%), Immigrants from Cabo Verde ($43,963, a difference of 0.27%), Immigrants from West Indies ($43,989, a difference of 0.33%), and Tsimshian ($43,695, a difference of 0.34%).
| Demographics | Rating | Rank | Median Earnings |
| Immigrants | Venezuela | 4.0 /100 | #242 | Tragic $44,163 |
| Sub-Saharan Africans | 3.7 /100 | #243 | Tragic $44,118 |
| Immigrants | Nonimmigrants | 3.7 /100 | #244 | Tragic $44,117 |
| Immigrants | Burma/Myanmar | 3.2 /100 | #245 | Tragic $43,998 |
| Immigrants | West Indies | 3.1 /100 | #246 | Tragic $43,989 |
| Immigrants | Cabo Verde | 3.0 /100 | #247 | Tragic $43,963 |
| Nepalese | 2.6 /100 | #248 | Tragic $43,860 |
| Malaysians | 2.6 /100 | #249 | Tragic $43,844 |
| Alaska Natives | 2.3 /100 | #250 | Tragic $43,750 |
| Tsimshian | 2.1 /100 | #251 | Tragic $43,695 |
| Hawaiians | 2.0 /100 | #252 | Tragic $43,673 |
| Somalis | 1.8 /100 | #253 | Tragic $43,567 |
| Liberians | 1.7 /100 | #254 | Tragic $43,536 |
| Immigrants | Middle Africa | 1.4 /100 | #255 | Tragic $43,416 |
| Alaskan Athabascans | 1.4 /100 | #256 | Tragic $43,393 |
Demographics Similar to Immigrants from Hong Kong by Median Earnings
In terms of median earnings, the demographic groups most similar to Immigrants from Hong Kong are Thai ($59,237, a difference of 0.33%), Immigrants from Singapore ($59,038, a difference of 0.67%), Iranian ($58,474, a difference of 1.6%), Immigrants from India ($60,648, a difference of 2.0%), and Immigrants from Taiwan ($61,151, a difference of 2.9%).
| Demographics | Rating | Rank | Median Earnings |
| Filipinos | 100.0 /100 | #1 | Exceptional $61,197 |
| Immigrants | Taiwan | 100.0 /100 | #2 | Exceptional $61,151 |
| Immigrants | India | 100.0 /100 | #3 | Exceptional $60,648 |
| Immigrants | Hong Kong | 100.0 /100 | #4 | Exceptional $59,433 |
| Thais | 100.0 /100 | #5 | Exceptional $59,237 |
| Immigrants | Singapore | 100.0 /100 | #6 | Exceptional $59,038 |
| Iranians | 100.0 /100 | #7 | Exceptional $58,474 |
| Immigrants | Iran | 100.0 /100 | #8 | Exceptional $57,612 |
| Okinawans | 100.0 /100 | #9 | Exceptional $57,550 |
| Immigrants | South Central Asia | 100.0 /100 | #10 | Exceptional $57,114 |
| Immigrants | Israel | 100.0 /100 | #11 | Exceptional $57,034 |
| Immigrants | Ireland | 100.0 /100 | #12 | Exceptional $56,854 |
| Immigrants | China | 100.0 /100 | #13 | Exceptional $56,638 |
| Immigrants | Australia | 100.0 /100 | #14 | Exceptional $56,305 |
| Indians (Asian) | 100.0 /100 | #15 | Exceptional $56,253 |