Blackfeet vs Immigrants from Hong Kong Single Female Poverty
COMPARE
Blackfeet
Immigrants from Hong Kong
Single Female Poverty
Single Female Poverty Comparison
Blackfeet
Immigrants from Hong Kong
25.1%
SINGLE FEMALE POVERTY
0.0/ 100
METRIC RATING
300th/ 347
METRIC RANK
16.5%
SINGLE FEMALE POVERTY
100.0/ 100
METRIC RATING
3rd/ 347
METRIC RANK
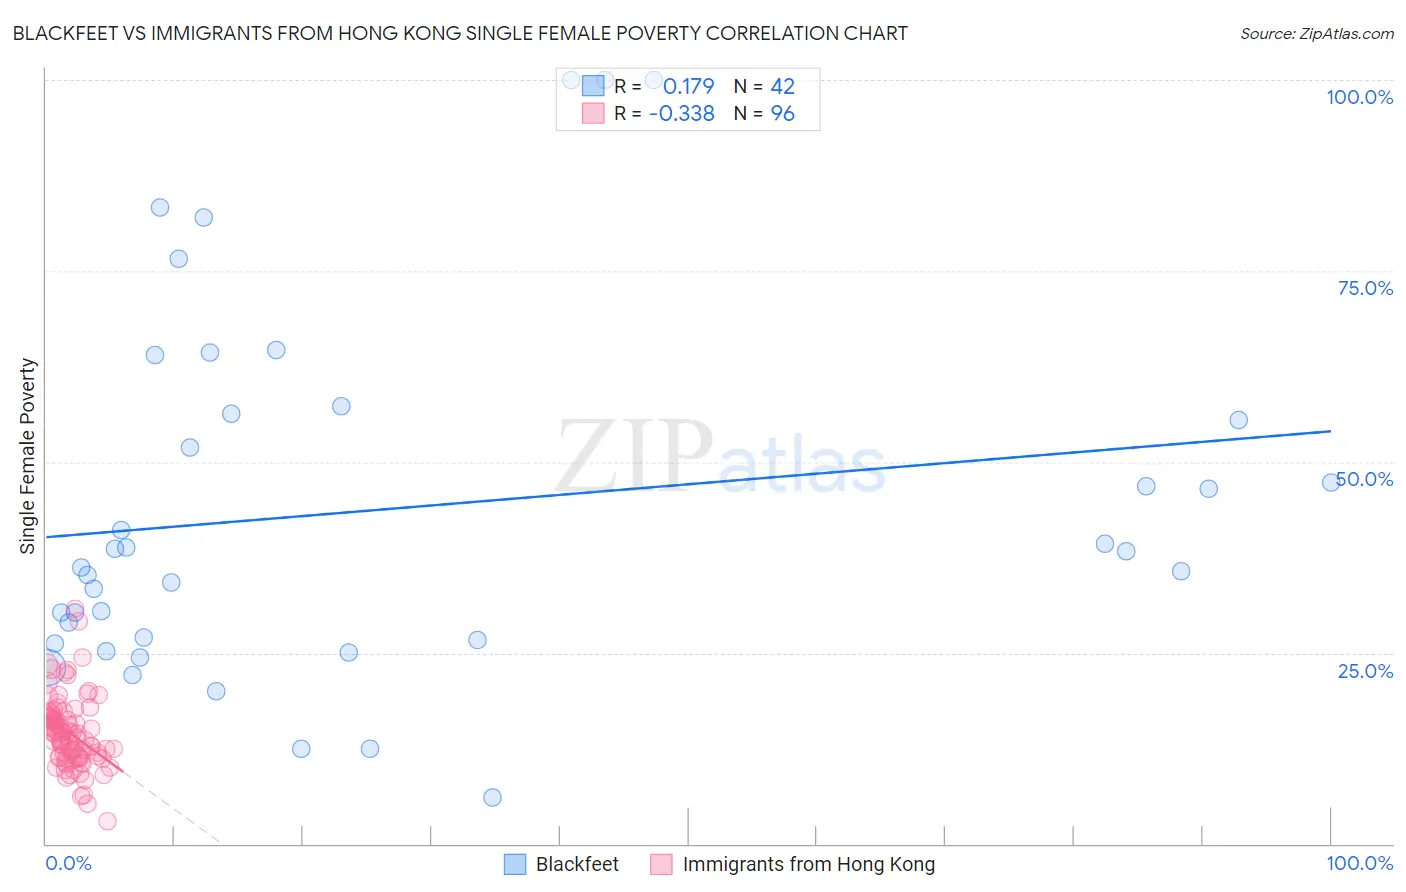
Blackfeet vs Immigrants from Hong Kong Single Female Poverty Correlation Chart
The statistical analysis conducted on geographies consisting of 307,344,342 people shows a poor positive correlation between the proportion of Blackfeet and poverty level among single females in the United States with a correlation coefficient (R) of 0.179 and weighted average of 25.1%. Similarly, the statistical analysis conducted on geographies consisting of 250,865,263 people shows a mild negative correlation between the proportion of Immigrants from Hong Kong and poverty level among single females in the United States with a correlation coefficient (R) of -0.338 and weighted average of 16.5%, a difference of 51.6%.
Single Female Poverty Correlation Summary
| Measurement | Blackfeet | Immigrants from Hong Kong |
| Minimum | 6.1% | 2.9% |
| Maximum | 100.0% | 30.8% |
| Range | 93.9% | 27.8% |
| Mean | 43.8% | 14.5% |
| Median | 37.2% | 14.1% |
| Interquartile 25% (IQ1) | 26.7% | 11.3% |
| Interquartile 75% (IQ3) | 56.2% | 16.7% |
| Interquartile Range (IQR) | 29.6% | 5.3% |
| Standard Deviation (Sample) | 23.9% | 4.6% |
| Standard Deviation (Population) | 23.6% | 4.6% |
Similar Demographics by Single Female Poverty
Demographics Similar to Blackfeet by Single Female Poverty
In terms of single female poverty, the demographic groups most similar to Blackfeet are Mexican (25.0%, a difference of 0.080%), Honduran (25.1%, a difference of 0.18%), Shoshone (25.1%, a difference of 0.26%), Somali (25.2%, a difference of 0.66%), and Yaqui (24.9%, a difference of 0.74%).
| Demographics | Rating | Rank | Single Female Poverty |
| Americans | 0.0 /100 | #293 | Tragic 24.5% |
| French American Indians | 0.0 /100 | #294 | Tragic 24.6% |
| Hispanics or Latinos | 0.0 /100 | #295 | Tragic 24.6% |
| Africans | 0.0 /100 | #296 | Tragic 24.8% |
| Immigrants | Central America | 0.0 /100 | #297 | Tragic 24.8% |
| Yaqui | 0.0 /100 | #298 | Tragic 24.9% |
| Mexicans | 0.0 /100 | #299 | Tragic 25.0% |
| Blackfeet | 0.0 /100 | #300 | Tragic 25.1% |
| Hondurans | 0.0 /100 | #301 | Tragic 25.1% |
| Shoshone | 0.0 /100 | #302 | Tragic 25.1% |
| Somalis | 0.0 /100 | #303 | Tragic 25.2% |
| Immigrants | Congo | 0.0 /100 | #304 | Tragic 25.3% |
| Immigrants | Dominican Republic | 0.0 /100 | #305 | Tragic 25.3% |
| Immigrants | Mexico | 0.0 /100 | #306 | Tragic 25.3% |
| Potawatomi | 0.0 /100 | #307 | Tragic 25.4% |
Demographics Similar to Immigrants from Hong Kong by Single Female Poverty
In terms of single female poverty, the demographic groups most similar to Immigrants from Hong Kong are Immigrants from Taiwan (16.4%, a difference of 1.1%), Immigrants from India (16.8%, a difference of 1.7%), Chinese (16.1%, a difference of 2.4%), Assyrian/Chaldean/Syriac (17.0%, a difference of 2.6%), and Filipino (17.0%, a difference of 2.8%).
| Demographics | Rating | Rank | Single Female Poverty |
| Chinese | 100.0 /100 | #1 | Exceptional 16.1% |
| Immigrants | Taiwan | 100.0 /100 | #2 | Exceptional 16.4% |
| Immigrants | Hong Kong | 100.0 /100 | #3 | Exceptional 16.5% |
| Immigrants | India | 100.0 /100 | #4 | Exceptional 16.8% |
| Assyrians/Chaldeans/Syriacs | 100.0 /100 | #5 | Exceptional 17.0% |
| Filipinos | 100.0 /100 | #6 | Exceptional 17.0% |
| Thais | 100.0 /100 | #7 | Exceptional 17.3% |
| Immigrants | Iran | 100.0 /100 | #8 | Exceptional 17.5% |
| Bhutanese | 100.0 /100 | #9 | Exceptional 17.7% |
| Immigrants | Ireland | 100.0 /100 | #10 | Exceptional 17.8% |
| Immigrants | Lithuania | 100.0 /100 | #11 | Exceptional 17.8% |
| Immigrants | South Central Asia | 100.0 /100 | #12 | Exceptional 17.8% |
| Immigrants | Bolivia | 100.0 /100 | #13 | Exceptional 17.8% |
| Bolivians | 100.0 /100 | #14 | Exceptional 17.9% |
| Indians (Asian) | 100.0 /100 | #15 | Exceptional 17.9% |