Blackfeet vs Immigrants from Hong Kong 10th Grade
COMPARE
Blackfeet
Immigrants from Hong Kong
10th Grade
10th Grade Comparison
Blackfeet
Immigrants from Hong Kong
93.7%
10TH GRADE
42.8/ 100
METRIC RATING
180th/ 347
METRIC RANK
93.1%
10TH GRADE
4.2/ 100
METRIC RATING
240th/ 347
METRIC RANK
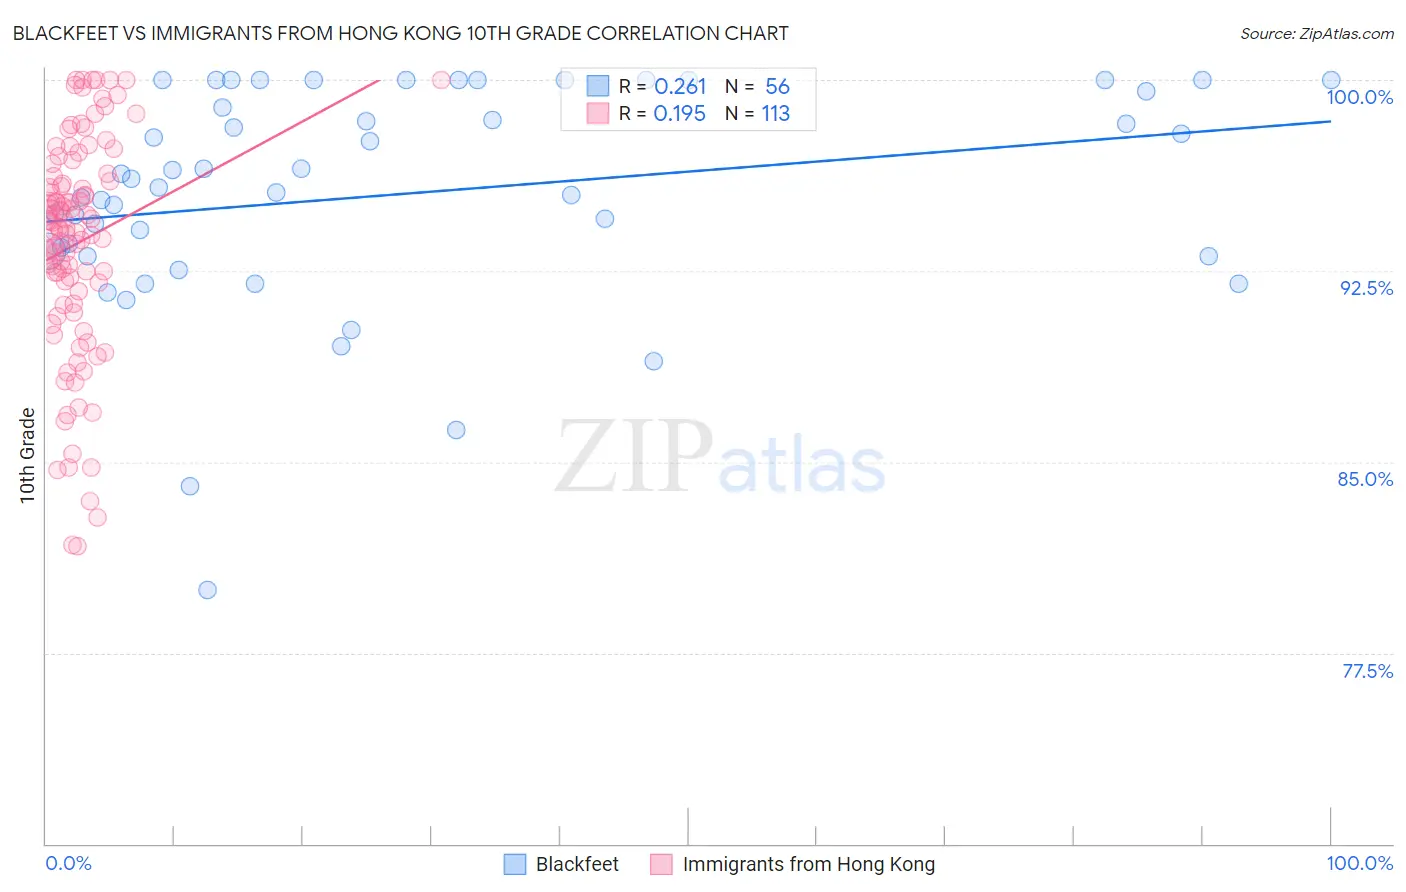
Blackfeet vs Immigrants from Hong Kong 10th Grade Correlation Chart
The statistical analysis conducted on geographies consisting of 309,582,133 people shows a weak positive correlation between the proportion of Blackfeet and percentage of population with at least 10th grade education in the United States with a correlation coefficient (R) of 0.261 and weighted average of 93.7%. Similarly, the statistical analysis conducted on geographies consisting of 253,990,382 people shows a poor positive correlation between the proportion of Immigrants from Hong Kong and percentage of population with at least 10th grade education in the United States with a correlation coefficient (R) of 0.195 and weighted average of 93.1%, a difference of 0.64%.
10th Grade Correlation Summary
| Measurement | Blackfeet | Immigrants from Hong Kong |
| Minimum | 80.0% | 81.7% |
| Maximum | 100.0% | 100.0% |
| Range | 20.0% | 18.3% |
| Mean | 95.5% | 93.6% |
| Median | 96.0% | 94.2% |
| Interquartile 25% (IQ1) | 93.2% | 91.5% |
| Interquartile 75% (IQ3) | 99.8% | 96.3% |
| Interquartile Range (IQR) | 6.6% | 4.8% |
| Standard Deviation (Sample) | 4.3% | 4.3% |
| Standard Deviation (Population) | 4.3% | 4.3% |
Similar Demographics by 10th Grade
Demographics Similar to Blackfeet by 10th Grade
In terms of 10th grade, the demographic groups most similar to Blackfeet are Immigrants from Northern Africa (93.7%, a difference of 0.010%), Paraguayan (93.7%, a difference of 0.020%), Sierra Leonean (93.7%, a difference of 0.030%), Immigrants from Argentina (93.7%, a difference of 0.040%), and Immigrants from Lebanon (93.7%, a difference of 0.040%).
| Demographics | Rating | Rank | 10th Grade |
| Spaniards | 50.3 /100 | #173 | Average 93.7% |
| Argentineans | 50.0 /100 | #174 | Average 93.7% |
| Immigrants | Nepal | 49.6 /100 | #175 | Average 93.7% |
| Immigrants | Argentina | 47.1 /100 | #176 | Average 93.7% |
| Immigrants | Lebanon | 47.1 /100 | #177 | Average 93.7% |
| Sierra Leoneans | 46.1 /100 | #178 | Average 93.7% |
| Paraguayans | 45.3 /100 | #179 | Average 93.7% |
| Blackfeet | 42.8 /100 | #180 | Average 93.7% |
| Immigrants | Northern Africa | 41.6 /100 | #181 | Average 93.7% |
| Colville | 38.8 /100 | #182 | Fair 93.6% |
| Guamanians/Chamorros | 37.1 /100 | #183 | Fair 93.6% |
| Choctaw | 36.6 /100 | #184 | Fair 93.6% |
| Sudanese | 36.6 /100 | #185 | Fair 93.6% |
| Immigrants | Eastern Asia | 35.1 /100 | #186 | Fair 93.6% |
| Liberians | 34.7 /100 | #187 | Fair 93.6% |
Demographics Similar to Immigrants from Hong Kong by 10th Grade
In terms of 10th grade, the demographic groups most similar to Immigrants from Hong Kong are Nigerian (93.1%, a difference of 0.0%), Costa Rican (93.1%, a difference of 0.0%), Immigrants from Panama (93.1%, a difference of 0.010%), African (93.1%, a difference of 0.020%), and Afghan (93.1%, a difference of 0.020%).
| Demographics | Rating | Rank | 10th Grade |
| Comanche | 4.9 /100 | #233 | Tragic 93.1% |
| Sub-Saharan Africans | 4.7 /100 | #234 | Tragic 93.1% |
| Africans | 4.6 /100 | #235 | Tragic 93.1% |
| Afghans | 4.5 /100 | #236 | Tragic 93.1% |
| Immigrants | Panama | 4.3 /100 | #237 | Tragic 93.1% |
| Nigerians | 4.2 /100 | #238 | Tragic 93.1% |
| Costa Ricans | 4.2 /100 | #239 | Tragic 93.1% |
| Immigrants | Hong Kong | 4.2 /100 | #240 | Tragic 93.1% |
| Immigrants | Somalia | 2.7 /100 | #241 | Tragic 93.0% |
| Immigrants | Cameroon | 2.6 /100 | #242 | Tragic 93.0% |
| Senegalese | 2.4 /100 | #243 | Tragic 93.0% |
| Spanish Americans | 2.1 /100 | #244 | Tragic 92.9% |
| Uruguayans | 1.8 /100 | #245 | Tragic 92.9% |
| Immigrants | Middle Africa | 1.7 /100 | #246 | Tragic 92.9% |
| Immigrants | Afghanistan | 1.4 /100 | #247 | Tragic 92.8% |