South African vs Immigrants from Hong Kong Median Earnings
COMPARE
South African
Immigrants from Hong Kong
Median Earnings
Median Earnings Comparison
South Africans
Immigrants from Hong Kong
$50,752
MEDIAN EARNINGS
99.8/ 100
METRIC RATING
74th/ 347
METRIC RANK
$59,433
MEDIAN EARNINGS
100.0/ 100
METRIC RATING
4th/ 347
METRIC RANK
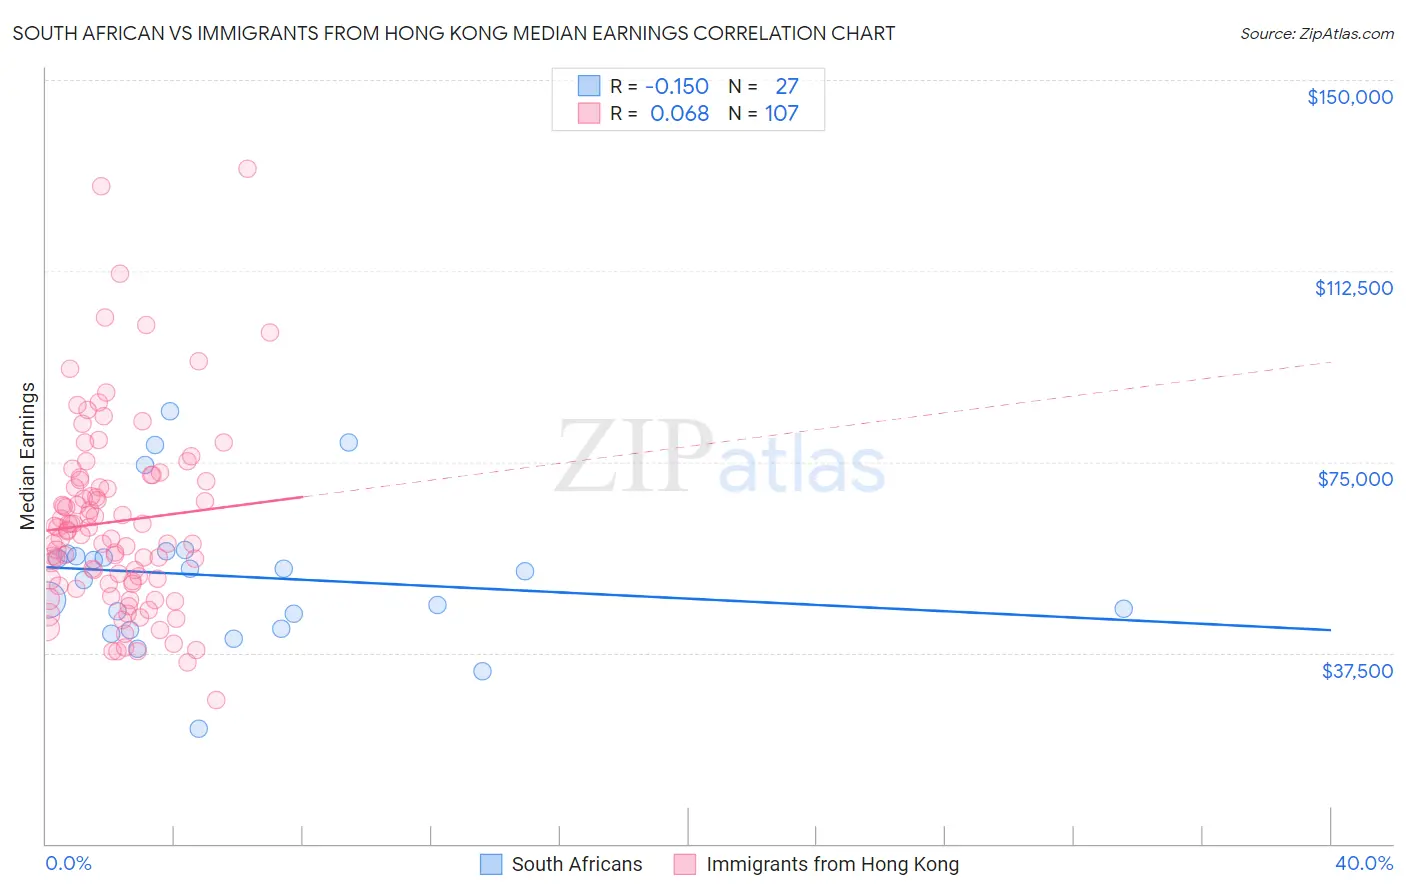
South African vs Immigrants from Hong Kong Median Earnings Correlation Chart
The statistical analysis conducted on geographies consisting of 182,600,845 people shows a poor negative correlation between the proportion of South Africans and median earnings in the United States with a correlation coefficient (R) of -0.150 and weighted average of $50,752. Similarly, the statistical analysis conducted on geographies consisting of 253,960,155 people shows a slight positive correlation between the proportion of Immigrants from Hong Kong and median earnings in the United States with a correlation coefficient (R) of 0.068 and weighted average of $59,433, a difference of 17.1%.
Median Earnings Correlation Summary
| Measurement | South African | Immigrants from Hong Kong |
| Minimum | $22,500 | $28,125 |
| Maximum | $84,919 | $132,614 |
| Range | $62,419 | $104,489 |
| Mean | $52,531 | $63,267 |
| Median | $53,417 | $61,404 |
| Interquartile 25% (IQ1) | $42,247 | $51,159 |
| Interquartile 75% (IQ3) | $56,939 | $71,509 |
| Interquartile Range (IQR) | $14,692 | $20,350 |
| Standard Deviation (Sample) | $14,077 | $18,453 |
| Standard Deviation (Population) | $13,814 | $18,367 |
Similar Demographics by Median Earnings
Demographics Similar to South Africans by Median Earnings
In terms of median earnings, the demographic groups most similar to South Africans are Immigrants from Scotland ($50,741, a difference of 0.020%), Immigrants from Netherlands ($50,818, a difference of 0.13%), Immigrants from Egypt ($50,901, a difference of 0.29%), Immigrants from Italy ($50,581, a difference of 0.34%), and Immigrants from Western Europe ($50,549, a difference of 0.40%).
| Demographics | Rating | Rank | Median Earnings |
| Immigrants | Spain | 99.9 /100 | #67 | Exceptional $51,092 |
| Paraguayans | 99.9 /100 | #68 | Exceptional $51,068 |
| Mongolians | 99.8 /100 | #69 | Exceptional $51,038 |
| Lithuanians | 99.8 /100 | #70 | Exceptional $50,991 |
| Immigrants | Ukraine | 99.8 /100 | #71 | Exceptional $50,984 |
| Immigrants | Egypt | 99.8 /100 | #72 | Exceptional $50,901 |
| Immigrants | Netherlands | 99.8 /100 | #73 | Exceptional $50,818 |
| South Africans | 99.8 /100 | #74 | Exceptional $50,752 |
| Immigrants | Scotland | 99.8 /100 | #75 | Exceptional $50,741 |
| Immigrants | Italy | 99.7 /100 | #76 | Exceptional $50,581 |
| Immigrants | Western Europe | 99.7 /100 | #77 | Exceptional $50,549 |
| Argentineans | 99.6 /100 | #78 | Exceptional $50,399 |
| Laotians | 99.6 /100 | #79 | Exceptional $50,343 |
| Ukrainians | 99.6 /100 | #80 | Exceptional $50,320 |
| Immigrants | Southern Europe | 99.6 /100 | #81 | Exceptional $50,280 |
Demographics Similar to Immigrants from Hong Kong by Median Earnings
In terms of median earnings, the demographic groups most similar to Immigrants from Hong Kong are Thai ($59,237, a difference of 0.33%), Immigrants from Singapore ($59,038, a difference of 0.67%), Iranian ($58,474, a difference of 1.6%), Immigrants from India ($60,648, a difference of 2.0%), and Immigrants from Taiwan ($61,151, a difference of 2.9%).
| Demographics | Rating | Rank | Median Earnings |
| Filipinos | 100.0 /100 | #1 | Exceptional $61,197 |
| Immigrants | Taiwan | 100.0 /100 | #2 | Exceptional $61,151 |
| Immigrants | India | 100.0 /100 | #3 | Exceptional $60,648 |
| Immigrants | Hong Kong | 100.0 /100 | #4 | Exceptional $59,433 |
| Thais | 100.0 /100 | #5 | Exceptional $59,237 |
| Immigrants | Singapore | 100.0 /100 | #6 | Exceptional $59,038 |
| Iranians | 100.0 /100 | #7 | Exceptional $58,474 |
| Immigrants | Iran | 100.0 /100 | #8 | Exceptional $57,612 |
| Okinawans | 100.0 /100 | #9 | Exceptional $57,550 |
| Immigrants | South Central Asia | 100.0 /100 | #10 | Exceptional $57,114 |
| Immigrants | Israel | 100.0 /100 | #11 | Exceptional $57,034 |
| Immigrants | Ireland | 100.0 /100 | #12 | Exceptional $56,854 |
| Immigrants | China | 100.0 /100 | #13 | Exceptional $56,638 |
| Immigrants | Australia | 100.0 /100 | #14 | Exceptional $56,305 |
| Indians (Asian) | 100.0 /100 | #15 | Exceptional $56,253 |