Hispanic or Latino vs Black/African American Per Capita Income
COMPARE
Hispanic or Latino
Black/African American
Per Capita Income
Per Capita Income Comparison
Hispanics or Latinos
Blacks/African Americans
$35,688
PER CAPITA INCOME
0.0/ 100
METRIC RATING
320th/ 347
METRIC RANK
$35,564
PER CAPITA INCOME
0.0/ 100
METRIC RATING
321st/ 347
METRIC RANK
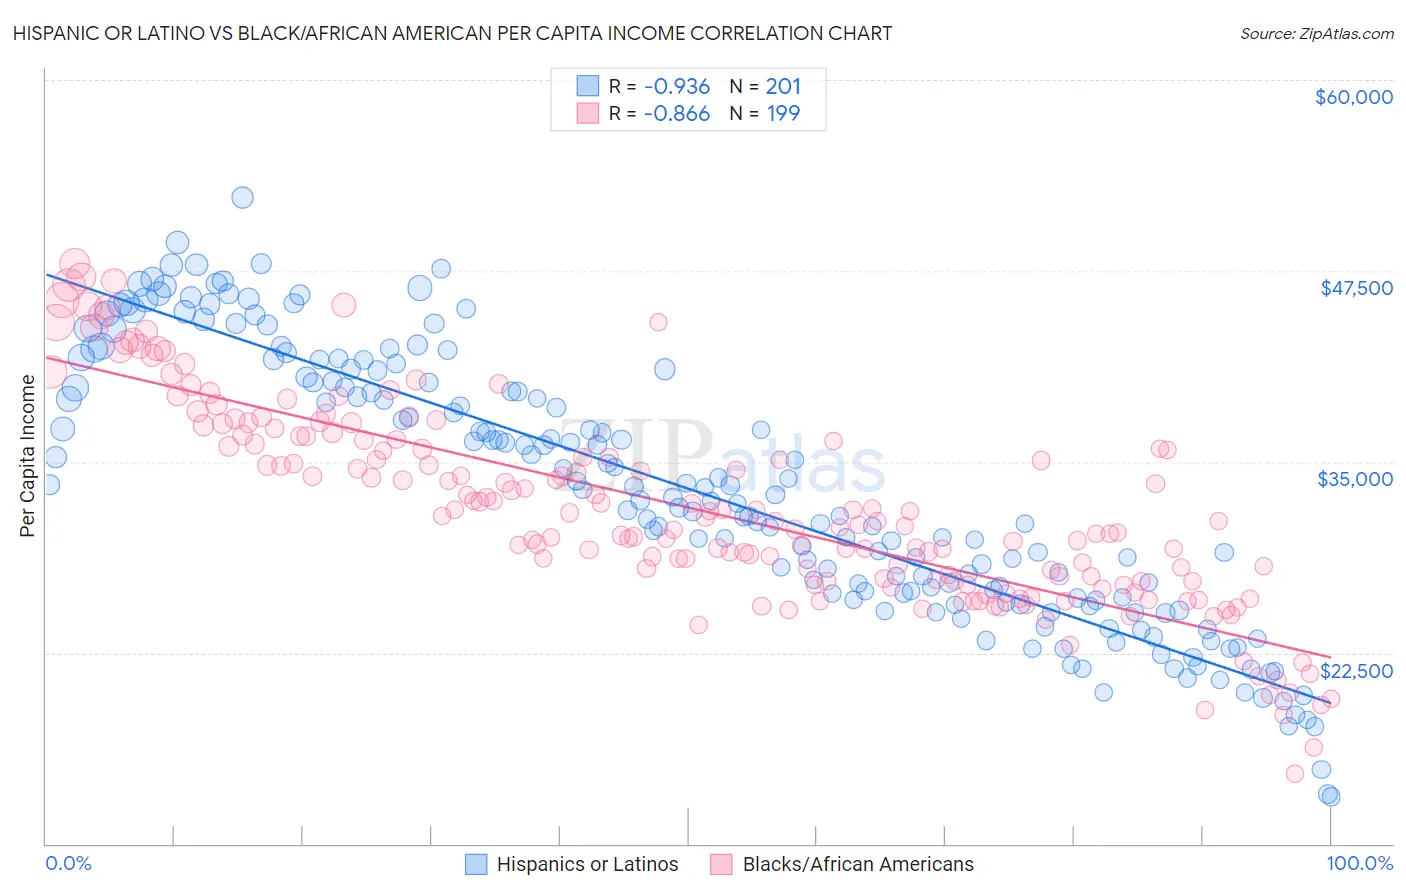
Hispanic or Latino vs Black/African American Per Capita Income Correlation Chart
The statistical analysis conducted on geographies consisting of 578,671,475 people shows a near-perfect negative correlation between the proportion of Hispanics or Latinos and per capita income in the United States with a correlation coefficient (R) of -0.936 and weighted average of $35,688. Similarly, the statistical analysis conducted on geographies consisting of 564,923,865 people shows a very strong negative correlation between the proportion of Blacks/African Americans and per capita income in the United States with a correlation coefficient (R) of -0.866 and weighted average of $35,564, a difference of 0.35%.
Per Capita Income Correlation Summary
| Measurement | Hispanic or Latino | Black/African American |
| Minimum | $13,071 | $14,598 |
| Maximum | $52,297 | $47,964 |
| Range | $39,226 | $33,366 |
| Mean | $33,168 | $32,008 |
| Median | $32,664 | $31,154 |
| Interquartile 25% (IQ1) | $26,111 | $27,216 |
| Interquartile 75% (IQ3) | $40,424 | $36,450 |
| Interquartile Range (IQR) | $14,314 | $9,234 |
| Standard Deviation (Sample) | $8,715 | $6,581 |
| Standard Deviation (Population) | $8,693 | $6,564 |
Demographics Similar to Hispanics or Latinos and Blacks/African Americans by Per Capita Income
In terms of per capita income, the demographic groups most similar to Hispanics or Latinos are Immigrants from Congo ($35,720, a difference of 0.090%), Creek ($35,546, a difference of 0.40%), Bangladeshi ($35,897, a difference of 0.59%), Dutch West Indian ($35,922, a difference of 0.66%), and Choctaw ($35,999, a difference of 0.87%). Similarly, the demographic groups most similar to Blacks/African Americans are Creek ($35,546, a difference of 0.050%), Immigrants from Congo ($35,720, a difference of 0.44%), Cheyenne ($35,276, a difference of 0.82%), Bangladeshi ($35,897, a difference of 0.94%), and Dutch West Indian ($35,922, a difference of 1.0%).
| Demographics | Rating | Rank | Per Capita Income |
| Ute | 0.0 /100 | #310 | Tragic $36,651 |
| Chippewa | 0.0 /100 | #311 | Tragic $36,631 |
| Chickasaw | 0.0 /100 | #312 | Tragic $36,475 |
| Bahamians | 0.0 /100 | #313 | Tragic $36,427 |
| Seminole | 0.0 /100 | #314 | Tragic $36,180 |
| Yaqui | 0.0 /100 | #315 | Tragic $36,112 |
| Choctaw | 0.0 /100 | #316 | Tragic $35,999 |
| Dutch West Indians | 0.0 /100 | #317 | Tragic $35,922 |
| Bangladeshis | 0.0 /100 | #318 | Tragic $35,897 |
| Immigrants | Congo | 0.0 /100 | #319 | Tragic $35,720 |
| Hispanics or Latinos | 0.0 /100 | #320 | Tragic $35,688 |
| Blacks/African Americans | 0.0 /100 | #321 | Tragic $35,564 |
| Creek | 0.0 /100 | #322 | Tragic $35,546 |
| Cheyenne | 0.0 /100 | #323 | Tragic $35,276 |
| Kiowa | 0.0 /100 | #324 | Tragic $35,102 |
| Immigrants | Central America | 0.0 /100 | #325 | Tragic $34,974 |
| Immigrants | Cuba | 0.0 /100 | #326 | Tragic $34,910 |
| Apache | 0.0 /100 | #327 | Tragic $34,886 |
| Menominee | 0.0 /100 | #328 | Tragic $34,578 |
| Mexicans | 0.0 /100 | #329 | Tragic $34,559 |
| Spanish American Indians | 0.0 /100 | #330 | Tragic $34,195 |