Blackfeet vs Black/African American Male Poverty
COMPARE
Blackfeet
Black/African American
Male Poverty
Male Poverty Comparison
Blackfeet
Blacks/African Americans
14.0%
MALE POVERTY
0.0/ 100
METRIC RATING
298th/ 347
METRIC RANK
15.8%
MALE POVERTY
0.0/ 100
METRIC RATING
328th/ 347
METRIC RANK
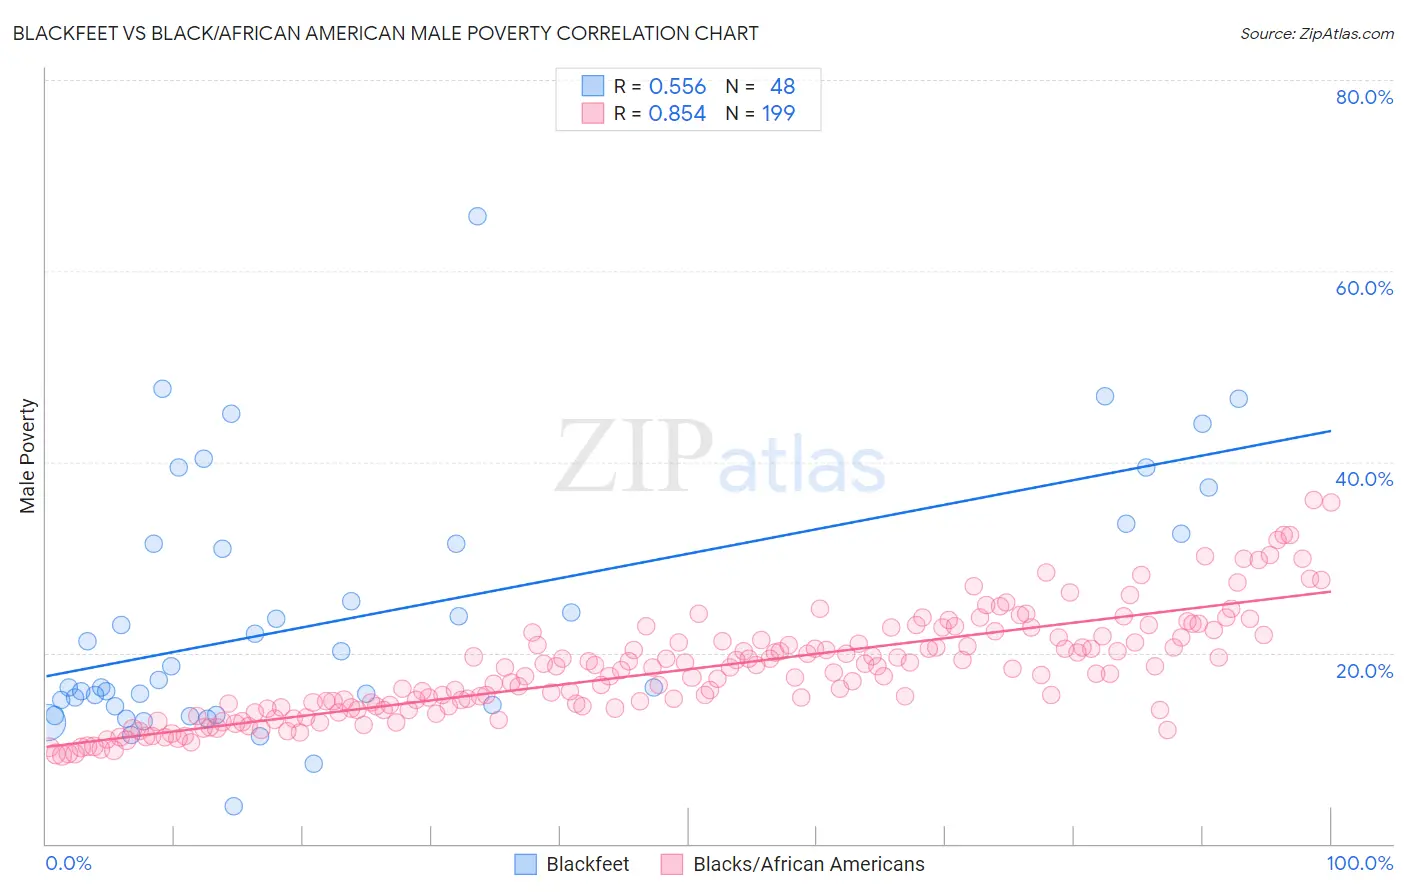
Blackfeet vs Black/African American Male Poverty Correlation Chart
The statistical analysis conducted on geographies consisting of 309,436,017 people shows a substantial positive correlation between the proportion of Blackfeet and poverty level among males in the United States with a correlation coefficient (R) of 0.556 and weighted average of 14.0%. Similarly, the statistical analysis conducted on geographies consisting of 564,646,557 people shows a very strong positive correlation between the proportion of Blacks/African Americans and poverty level among males in the United States with a correlation coefficient (R) of 0.854 and weighted average of 15.8%, a difference of 12.9%.
Male Poverty Correlation Summary
| Measurement | Blackfeet | Black/African American |
| Minimum | 3.9% | 9.3% |
| Maximum | 65.7% | 36.0% |
| Range | 61.8% | 26.8% |
| Mean | 23.9% | 18.2% |
| Median | 17.9% | 17.9% |
| Interquartile 25% (IQ1) | 14.4% | 14.2% |
| Interquartile 75% (IQ3) | 31.9% | 21.3% |
| Interquartile Range (IQR) | 17.5% | 7.1% |
| Standard Deviation (Sample) | 13.2% | 5.5% |
| Standard Deviation (Population) | 13.0% | 5.5% |
Similar Demographics by Male Poverty
Demographics Similar to Blackfeet by Male Poverty
In terms of male poverty, the demographic groups most similar to Blackfeet are Inupiat (14.0%, a difference of 0.030%), Immigrants from Guatemala (14.0%, a difference of 0.10%), Immigrants from Mexico (14.0%, a difference of 0.22%), Immigrants from Senegal (14.0%, a difference of 0.29%), and Immigrants from Caribbean (14.0%, a difference of 0.34%).
| Demographics | Rating | Rank | Male Poverty |
| Vietnamese | 0.0 /100 | #291 | Tragic 13.8% |
| Indonesians | 0.0 /100 | #292 | Tragic 13.8% |
| Immigrants | Belize | 0.0 /100 | #293 | Tragic 13.8% |
| Hispanics or Latinos | 0.0 /100 | #294 | Tragic 13.9% |
| Immigrants | Central America | 0.0 /100 | #295 | Tragic 13.9% |
| Cajuns | 0.0 /100 | #296 | Tragic 13.9% |
| Inupiat | 0.0 /100 | #297 | Tragic 14.0% |
| Blackfeet | 0.0 /100 | #298 | Tragic 14.0% |
| Immigrants | Guatemala | 0.0 /100 | #299 | Tragic 14.0% |
| Immigrants | Mexico | 0.0 /100 | #300 | Tragic 14.0% |
| Immigrants | Senegal | 0.0 /100 | #301 | Tragic 14.0% |
| Immigrants | Caribbean | 0.0 /100 | #302 | Tragic 14.0% |
| Bahamians | 0.0 /100 | #303 | Tragic 14.1% |
| Senegalese | 0.0 /100 | #304 | Tragic 14.1% |
| Immigrants | Bangladesh | 0.0 /100 | #305 | Tragic 14.1% |
Demographics Similar to Blacks/African Americans by Male Poverty
In terms of male poverty, the demographic groups most similar to Blacks/African Americans are Paiute (15.8%, a difference of 0.060%), Dominican (16.1%, a difference of 1.7%), Immigrants from Dominican Republic (16.2%, a difference of 2.4%), Ute (16.2%, a difference of 2.7%), and Central American Indian (15.3%, a difference of 3.2%).
| Demographics | Rating | Rank | Male Poverty |
| Arapaho | 0.0 /100 | #321 | Tragic 15.1% |
| Kiowa | 0.0 /100 | #322 | Tragic 15.2% |
| Colville | 0.0 /100 | #323 | Tragic 15.2% |
| Menominee | 0.0 /100 | #324 | Tragic 15.3% |
| Yakama | 0.0 /100 | #325 | Tragic 15.3% |
| Central American Indians | 0.0 /100 | #326 | Tragic 15.3% |
| Paiute | 0.0 /100 | #327 | Tragic 15.8% |
| Blacks/African Americans | 0.0 /100 | #328 | Tragic 15.8% |
| Dominicans | 0.0 /100 | #329 | Tragic 16.1% |
| Immigrants | Dominican Republic | 0.0 /100 | #330 | Tragic 16.2% |
| Ute | 0.0 /100 | #331 | Tragic 16.2% |
| Houma | 0.0 /100 | #332 | Tragic 16.7% |
| Natives/Alaskans | 0.0 /100 | #333 | Tragic 16.9% |
| Cheyenne | 0.0 /100 | #334 | Tragic 17.6% |
| Apache | 0.0 /100 | #335 | Tragic 17.7% |