Bhutanese vs Immigrants from China Median Male Earnings
COMPARE
Bhutanese
Immigrants from China
Median Male Earnings
Median Male Earnings Comparison
Bhutanese
Immigrants from China
$61,759
MEDIAN MALE EARNINGS
99.9/ 100
METRIC RATING
50th/ 347
METRIC RANK
$67,353
MEDIAN MALE EARNINGS
100.0/ 100
METRIC RATING
13th/ 347
METRIC RANK
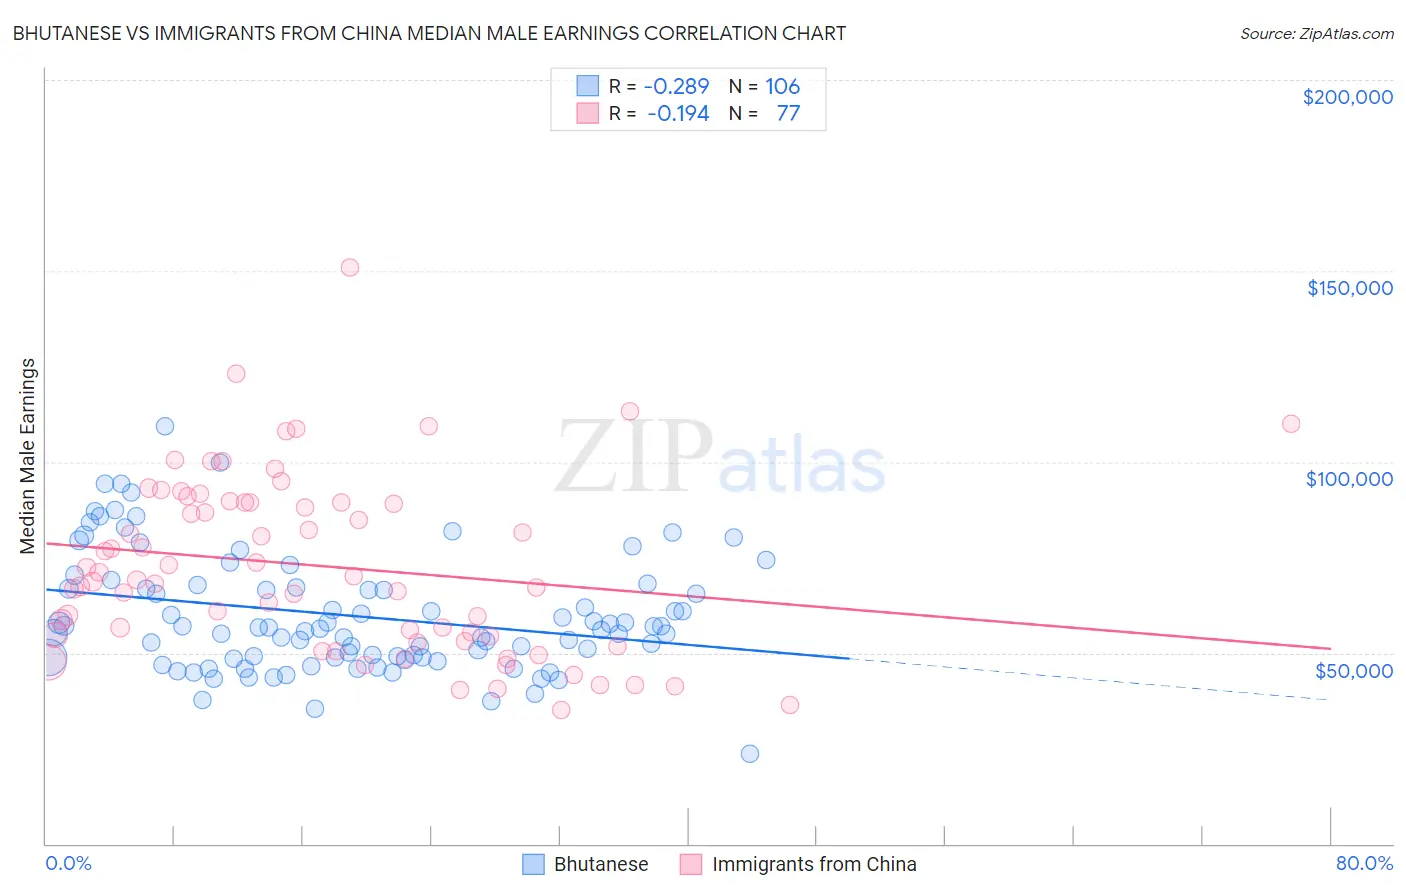
Bhutanese vs Immigrants from China Median Male Earnings Correlation Chart
The statistical analysis conducted on geographies consisting of 455,387,679 people shows a weak negative correlation between the proportion of Bhutanese and median male earnings in the United States with a correlation coefficient (R) of -0.289 and weighted average of $61,759. Similarly, the statistical analysis conducted on geographies consisting of 456,906,248 people shows a poor negative correlation between the proportion of Immigrants from China and median male earnings in the United States with a correlation coefficient (R) of -0.194 and weighted average of $67,353, a difference of 9.1%.
Median Male Earnings Correlation Summary
| Measurement | Bhutanese | Immigrants from China |
| Minimum | $23,594 | $35,000 |
| Maximum | $109,392 | $150,740 |
| Range | $85,798 | $115,740 |
| Mean | $59,697 | $72,671 |
| Median | $56,402 | $69,216 |
| Interquartile 25% (IQ1) | $48,730 | $53,825 |
| Interquartile 75% (IQ3) | $67,058 | $89,334 |
| Interquartile Range (IQR) | $18,327 | $35,509 |
| Standard Deviation (Sample) | $15,498 | $23,135 |
| Standard Deviation (Population) | $15,425 | $22,985 |
Similar Demographics by Median Male Earnings
Demographics Similar to Bhutanese by Median Male Earnings
In terms of median male earnings, the demographic groups most similar to Bhutanese are Estonian ($61,710, a difference of 0.080%), Immigrants from Norway ($61,628, a difference of 0.21%), Immigrants from Europe ($62,057, a difference of 0.48%), South African ($61,460, a difference of 0.49%), and Immigrants from Latvia ($61,422, a difference of 0.55%).
| Demographics | Rating | Rank | Median Male Earnings |
| Immigrants | Belarus | 100.0 /100 | #43 | Exceptional $62,658 |
| Cambodians | 100.0 /100 | #44 | Exceptional $62,516 |
| Bulgarians | 100.0 /100 | #45 | Exceptional $62,378 |
| Immigrants | Czechoslovakia | 99.9 /100 | #46 | Exceptional $62,217 |
| Immigrants | Austria | 99.9 /100 | #47 | Exceptional $62,164 |
| Immigrants | Malaysia | 99.9 /100 | #48 | Exceptional $62,121 |
| Immigrants | Europe | 99.9 /100 | #49 | Exceptional $62,057 |
| Bhutanese | 99.9 /100 | #50 | Exceptional $61,759 |
| Estonians | 99.9 /100 | #51 | Exceptional $61,710 |
| Immigrants | Norway | 99.9 /100 | #52 | Exceptional $61,628 |
| South Africans | 99.9 /100 | #53 | Exceptional $61,460 |
| Immigrants | Latvia | 99.9 /100 | #54 | Exceptional $61,422 |
| Greeks | 99.9 /100 | #55 | Exceptional $61,242 |
| Lithuanians | 99.9 /100 | #56 | Exceptional $61,228 |
| Immigrants | Scotland | 99.9 /100 | #57 | Exceptional $61,220 |
Demographics Similar to Immigrants from China by Median Male Earnings
In terms of median male earnings, the demographic groups most similar to Immigrants from China are Okinawan ($67,232, a difference of 0.18%), Immigrants from Australia ($67,634, a difference of 0.42%), Immigrants from Ireland ($67,698, a difference of 0.51%), Immigrants from Eastern Asia ($66,903, a difference of 0.67%), and Eastern European ($66,472, a difference of 1.3%).
| Demographics | Rating | Rank | Median Male Earnings |
| Iranians | 100.0 /100 | #6 | Exceptional $70,648 |
| Immigrants | Hong Kong | 100.0 /100 | #7 | Exceptional $70,146 |
| Immigrants | Iran | 100.0 /100 | #8 | Exceptional $69,284 |
| Immigrants | South Central Asia | 100.0 /100 | #9 | Exceptional $68,960 |
| Immigrants | Israel | 100.0 /100 | #10 | Exceptional $68,716 |
| Immigrants | Ireland | 100.0 /100 | #11 | Exceptional $67,698 |
| Immigrants | Australia | 100.0 /100 | #12 | Exceptional $67,634 |
| Immigrants | China | 100.0 /100 | #13 | Exceptional $67,353 |
| Okinawans | 100.0 /100 | #14 | Exceptional $67,232 |
| Immigrants | Eastern Asia | 100.0 /100 | #15 | Exceptional $66,903 |
| Eastern Europeans | 100.0 /100 | #16 | Exceptional $66,472 |
| Immigrants | Belgium | 100.0 /100 | #17 | Exceptional $66,125 |
| Indians (Asian) | 100.0 /100 | #18 | Exceptional $66,078 |
| Cypriots | 100.0 /100 | #19 | Exceptional $65,549 |
| Immigrants | Japan | 100.0 /100 | #20 | Exceptional $65,518 |