Bhutanese vs Brazilian Median Male Earnings
COMPARE
Bhutanese
Brazilian
Median Male Earnings
Median Male Earnings Comparison
Bhutanese
Brazilians
$61,759
MEDIAN MALE EARNINGS
99.9/ 100
METRIC RATING
50th/ 347
METRIC RANK
$56,837
MEDIAN MALE EARNINGS
90.9/ 100
METRIC RATING
127th/ 347
METRIC RANK
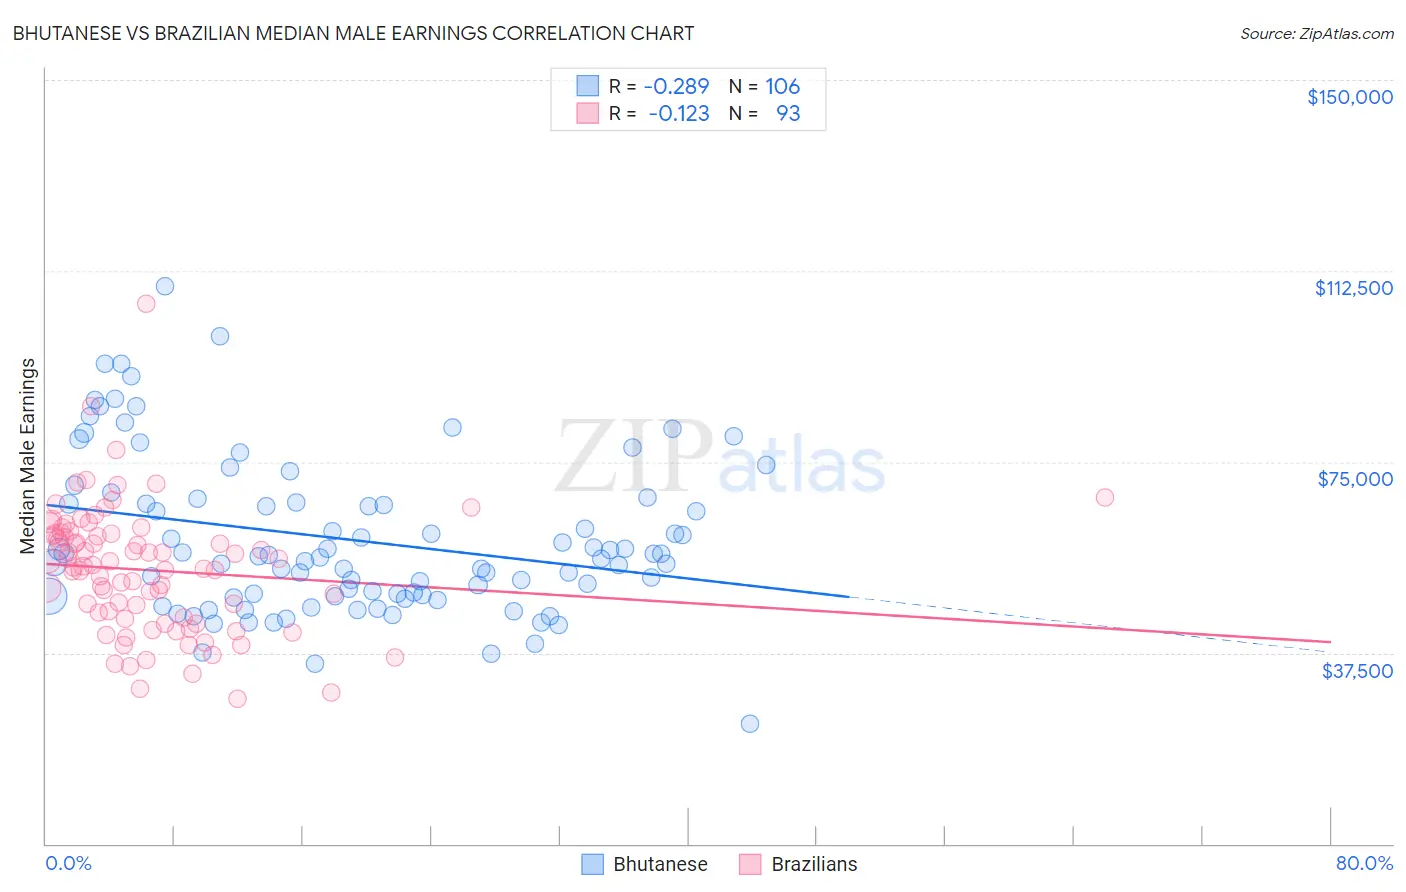
Bhutanese vs Brazilian Median Male Earnings Correlation Chart
The statistical analysis conducted on geographies consisting of 455,387,679 people shows a weak negative correlation between the proportion of Bhutanese and median male earnings in the United States with a correlation coefficient (R) of -0.289 and weighted average of $61,759. Similarly, the statistical analysis conducted on geographies consisting of 323,892,839 people shows a poor negative correlation between the proportion of Brazilians and median male earnings in the United States with a correlation coefficient (R) of -0.123 and weighted average of $56,837, a difference of 8.7%.
Median Male Earnings Correlation Summary
| Measurement | Bhutanese | Brazilian |
| Minimum | $23,594 | $28,554 |
| Maximum | $109,392 | $105,938 |
| Range | $85,798 | $77,384 |
| Mean | $59,697 | $53,733 |
| Median | $56,402 | $54,435 |
| Interquartile 25% (IQ1) | $48,730 | $44,298 |
| Interquartile 75% (IQ3) | $67,058 | $60,844 |
| Interquartile Range (IQR) | $18,327 | $16,546 |
| Standard Deviation (Sample) | $15,498 | $12,418 |
| Standard Deviation (Population) | $15,425 | $12,351 |
Similar Demographics by Median Male Earnings
Demographics Similar to Bhutanese by Median Male Earnings
In terms of median male earnings, the demographic groups most similar to Bhutanese are Estonian ($61,710, a difference of 0.080%), Immigrants from Norway ($61,628, a difference of 0.21%), Immigrants from Europe ($62,057, a difference of 0.48%), South African ($61,460, a difference of 0.49%), and Immigrants from Latvia ($61,422, a difference of 0.55%).
| Demographics | Rating | Rank | Median Male Earnings |
| Immigrants | Belarus | 100.0 /100 | #43 | Exceptional $62,658 |
| Cambodians | 100.0 /100 | #44 | Exceptional $62,516 |
| Bulgarians | 100.0 /100 | #45 | Exceptional $62,378 |
| Immigrants | Czechoslovakia | 99.9 /100 | #46 | Exceptional $62,217 |
| Immigrants | Austria | 99.9 /100 | #47 | Exceptional $62,164 |
| Immigrants | Malaysia | 99.9 /100 | #48 | Exceptional $62,121 |
| Immigrants | Europe | 99.9 /100 | #49 | Exceptional $62,057 |
| Bhutanese | 99.9 /100 | #50 | Exceptional $61,759 |
| Estonians | 99.9 /100 | #51 | Exceptional $61,710 |
| Immigrants | Norway | 99.9 /100 | #52 | Exceptional $61,628 |
| South Africans | 99.9 /100 | #53 | Exceptional $61,460 |
| Immigrants | Latvia | 99.9 /100 | #54 | Exceptional $61,422 |
| Greeks | 99.9 /100 | #55 | Exceptional $61,242 |
| Lithuanians | 99.9 /100 | #56 | Exceptional $61,228 |
| Immigrants | Scotland | 99.9 /100 | #57 | Exceptional $61,220 |
Demographics Similar to Brazilians by Median Male Earnings
In terms of median male earnings, the demographic groups most similar to Brazilians are Immigrants from Syria ($56,830, a difference of 0.010%), Chinese ($56,872, a difference of 0.060%), Immigrants from Morocco ($56,958, a difference of 0.21%), Pakistani ($56,719, a difference of 0.21%), and Chilean ($56,973, a difference of 0.24%).
| Demographics | Rating | Rank | Median Male Earnings |
| Canadians | 93.9 /100 | #120 | Exceptional $57,286 |
| Immigrants | Albania | 93.3 /100 | #121 | Exceptional $57,179 |
| Immigrants | Jordan | 93.1 /100 | #122 | Exceptional $57,145 |
| Slovenes | 93.1 /100 | #123 | Exceptional $57,145 |
| Chileans | 91.9 /100 | #124 | Exceptional $56,973 |
| Immigrants | Morocco | 91.8 /100 | #125 | Exceptional $56,958 |
| Chinese | 91.1 /100 | #126 | Exceptional $56,872 |
| Brazilians | 90.9 /100 | #127 | Exceptional $56,837 |
| Immigrants | Syria | 90.8 /100 | #128 | Exceptional $56,830 |
| Pakistanis | 89.9 /100 | #129 | Excellent $56,719 |
| Koreans | 89.4 /100 | #130 | Excellent $56,672 |
| Portuguese | 89.4 /100 | #131 | Excellent $56,663 |
| Czechs | 88.2 /100 | #132 | Excellent $56,546 |
| Immigrants | Germany | 88.2 /100 | #133 | Excellent $56,542 |
| Moroccans | 87.7 /100 | #134 | Excellent $56,499 |