Slovak vs Immigrants from China Median Male Earnings
COMPARE
Slovak
Immigrants from China
Median Male Earnings
Median Male Earnings Comparison
Slovaks
Immigrants from China
$56,306
MEDIAN MALE EARNINGS
85.5/ 100
METRIC RATING
138th/ 347
METRIC RANK
$67,353
MEDIAN MALE EARNINGS
100.0/ 100
METRIC RATING
13th/ 347
METRIC RANK
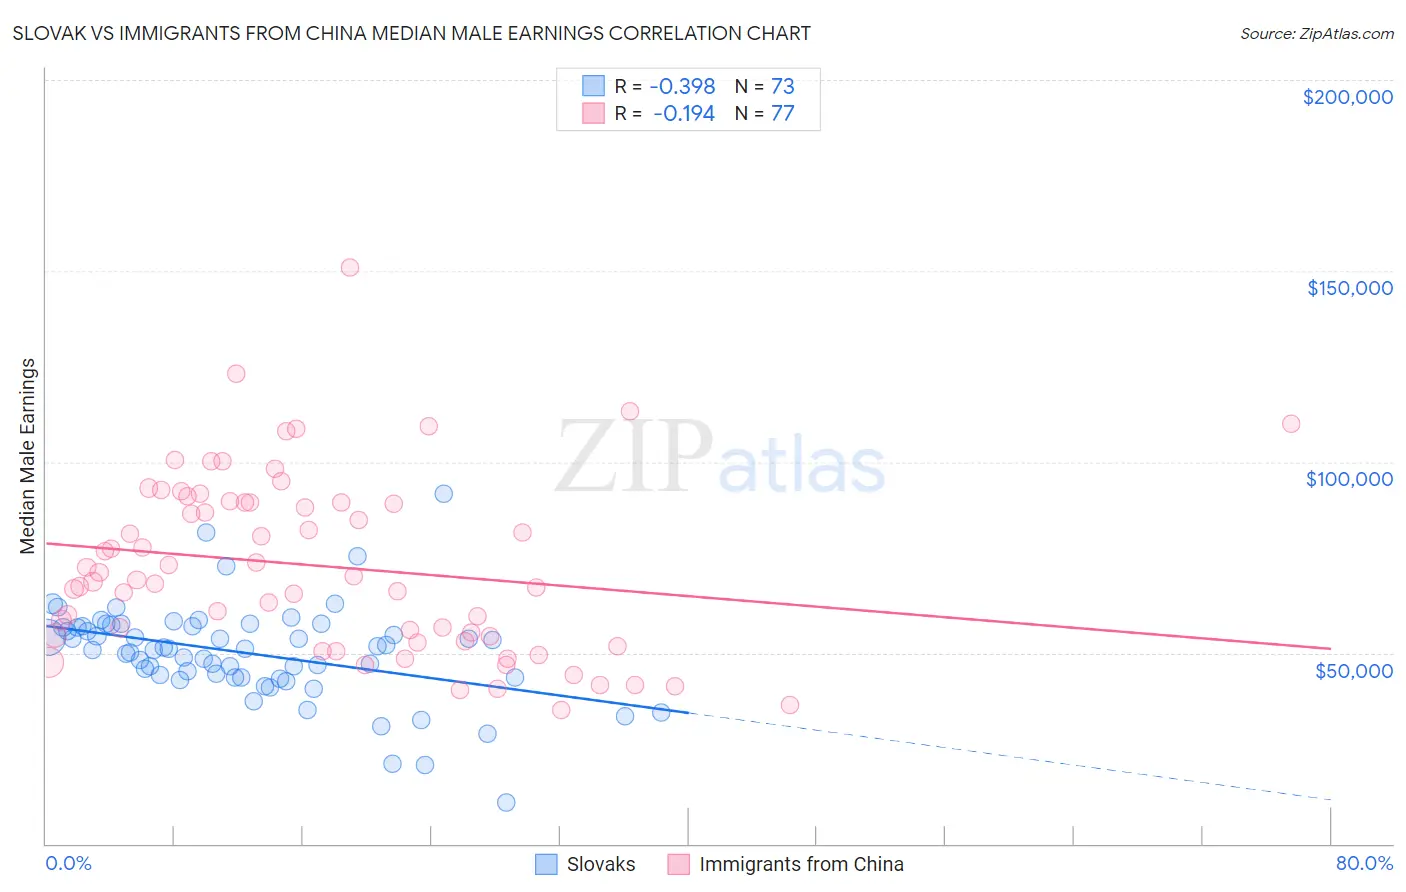
Slovak vs Immigrants from China Median Male Earnings Correlation Chart
The statistical analysis conducted on geographies consisting of 397,698,254 people shows a mild negative correlation between the proportion of Slovaks and median male earnings in the United States with a correlation coefficient (R) of -0.398 and weighted average of $56,306. Similarly, the statistical analysis conducted on geographies consisting of 456,906,248 people shows a poor negative correlation between the proportion of Immigrants from China and median male earnings in the United States with a correlation coefficient (R) of -0.194 and weighted average of $67,353, a difference of 19.6%.
Median Male Earnings Correlation Summary
| Measurement | Slovak | Immigrants from China |
| Minimum | $10,727 | $35,000 |
| Maximum | $91,563 | $150,740 |
| Range | $80,836 | $115,740 |
| Mean | $49,965 | $72,671 |
| Median | $50,933 | $69,216 |
| Interquartile 25% (IQ1) | $43,560 | $53,825 |
| Interquartile 75% (IQ3) | $56,815 | $89,334 |
| Interquartile Range (IQR) | $13,254 | $35,509 |
| Standard Deviation (Sample) | $12,608 | $23,135 |
| Standard Deviation (Population) | $12,522 | $22,985 |
Similar Demographics by Median Male Earnings
Demographics Similar to Slovaks by Median Male Earnings
In terms of median male earnings, the demographic groups most similar to Slovaks are Zimbabwean ($56,302, a difference of 0.010%), Luxembourger ($56,300, a difference of 0.010%), Danish ($56,246, a difference of 0.11%), Ethiopian ($56,243, a difference of 0.11%), and Slavic ($56,390, a difference of 0.15%).
| Demographics | Rating | Rank | Median Male Earnings |
| Portuguese | 89.4 /100 | #131 | Excellent $56,663 |
| Czechs | 88.2 /100 | #132 | Excellent $56,546 |
| Immigrants | Germany | 88.2 /100 | #133 | Excellent $56,542 |
| Moroccans | 87.7 /100 | #134 | Excellent $56,499 |
| Irish | 87.4 /100 | #135 | Excellent $56,464 |
| Immigrants | Saudi Arabia | 87.2 /100 | #136 | Excellent $56,452 |
| Slavs | 86.5 /100 | #137 | Excellent $56,390 |
| Slovaks | 85.5 /100 | #138 | Excellent $56,306 |
| Zimbabweans | 85.5 /100 | #139 | Excellent $56,302 |
| Luxembourgers | 85.5 /100 | #140 | Excellent $56,300 |
| Danes | 84.8 /100 | #141 | Excellent $56,246 |
| Ethiopians | 84.8 /100 | #142 | Excellent $56,243 |
| Sri Lankans | 83.4 /100 | #143 | Excellent $56,136 |
| Immigrants | Uganda | 82.4 /100 | #144 | Excellent $56,064 |
| Norwegians | 80.9 /100 | #145 | Excellent $55,965 |
Demographics Similar to Immigrants from China by Median Male Earnings
In terms of median male earnings, the demographic groups most similar to Immigrants from China are Okinawan ($67,232, a difference of 0.18%), Immigrants from Australia ($67,634, a difference of 0.42%), Immigrants from Ireland ($67,698, a difference of 0.51%), Immigrants from Eastern Asia ($66,903, a difference of 0.67%), and Eastern European ($66,472, a difference of 1.3%).
| Demographics | Rating | Rank | Median Male Earnings |
| Iranians | 100.0 /100 | #6 | Exceptional $70,648 |
| Immigrants | Hong Kong | 100.0 /100 | #7 | Exceptional $70,146 |
| Immigrants | Iran | 100.0 /100 | #8 | Exceptional $69,284 |
| Immigrants | South Central Asia | 100.0 /100 | #9 | Exceptional $68,960 |
| Immigrants | Israel | 100.0 /100 | #10 | Exceptional $68,716 |
| Immigrants | Ireland | 100.0 /100 | #11 | Exceptional $67,698 |
| Immigrants | Australia | 100.0 /100 | #12 | Exceptional $67,634 |
| Immigrants | China | 100.0 /100 | #13 | Exceptional $67,353 |
| Okinawans | 100.0 /100 | #14 | Exceptional $67,232 |
| Immigrants | Eastern Asia | 100.0 /100 | #15 | Exceptional $66,903 |
| Eastern Europeans | 100.0 /100 | #16 | Exceptional $66,472 |
| Immigrants | Belgium | 100.0 /100 | #17 | Exceptional $66,125 |
| Indians (Asian) | 100.0 /100 | #18 | Exceptional $66,078 |
| Cypriots | 100.0 /100 | #19 | Exceptional $65,549 |
| Immigrants | Japan | 100.0 /100 | #20 | Exceptional $65,518 |