Bhutanese vs Hispanic or Latino Median Male Earnings
COMPARE
Bhutanese
Hispanic or Latino
Median Male Earnings
Median Male Earnings Comparison
Bhutanese
Hispanics or Latinos
$61,759
MEDIAN MALE EARNINGS
99.9/ 100
METRIC RATING
50th/ 347
METRIC RANK
$46,419
MEDIAN MALE EARNINGS
0.0/ 100
METRIC RATING
312th/ 347
METRIC RANK
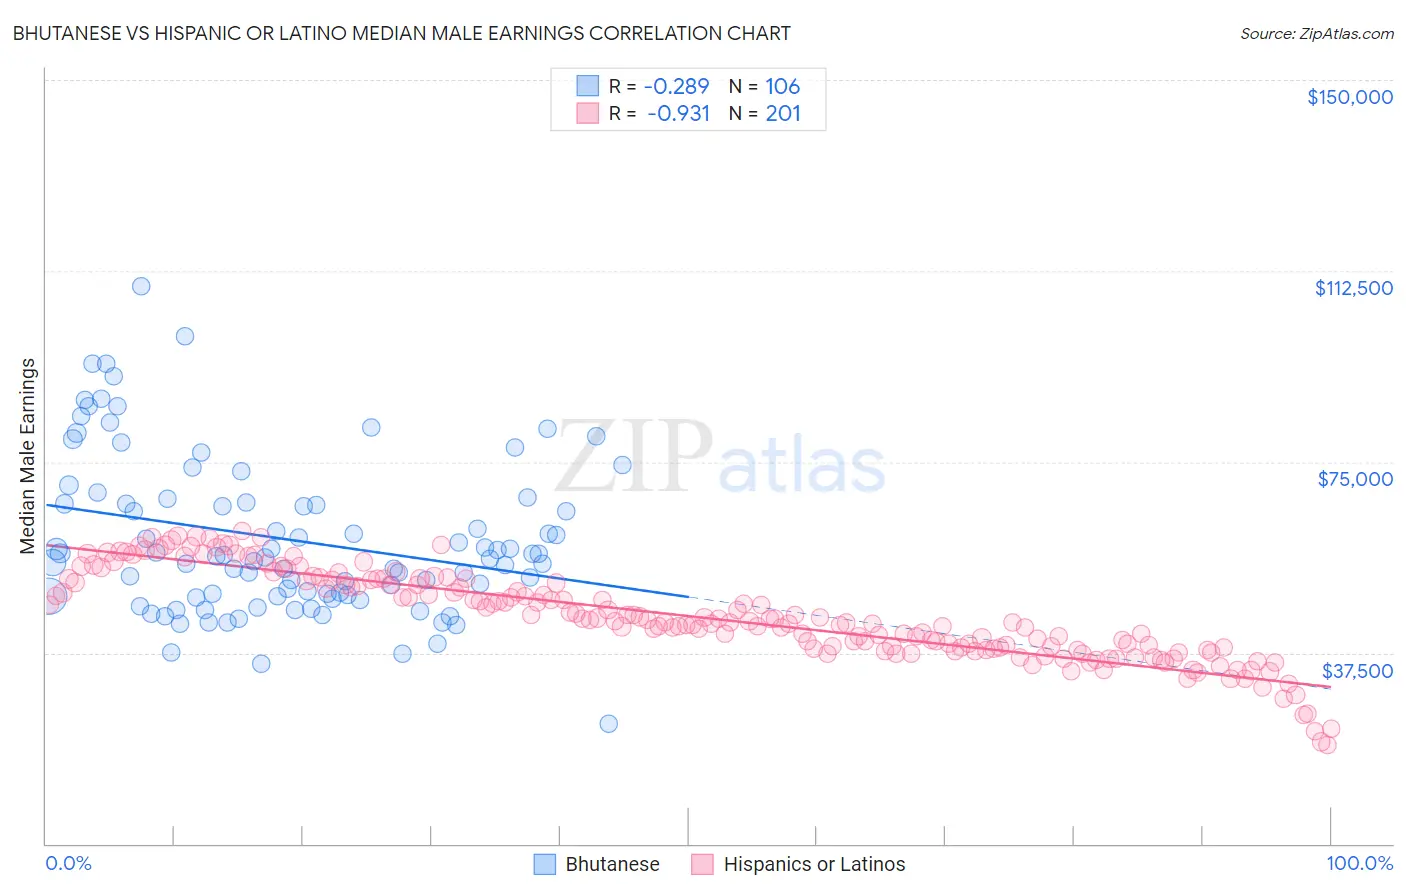
Bhutanese vs Hispanic or Latino Median Male Earnings Correlation Chart
The statistical analysis conducted on geographies consisting of 455,387,679 people shows a weak negative correlation between the proportion of Bhutanese and median male earnings in the United States with a correlation coefficient (R) of -0.289 and weighted average of $61,759. Similarly, the statistical analysis conducted on geographies consisting of 577,008,191 people shows a near-perfect negative correlation between the proportion of Hispanics or Latinos and median male earnings in the United States with a correlation coefficient (R) of -0.931 and weighted average of $46,419, a difference of 33.1%.
Median Male Earnings Correlation Summary
| Measurement | Bhutanese | Hispanic or Latino |
| Minimum | $23,594 | $19,304 |
| Maximum | $109,392 | $61,420 |
| Range | $85,798 | $42,115 |
| Mean | $59,697 | $44,646 |
| Median | $56,402 | $43,909 |
| Interquartile 25% (IQ1) | $48,730 | $38,393 |
| Interquartile 75% (IQ3) | $67,058 | $51,713 |
| Interquartile Range (IQR) | $18,327 | $13,320 |
| Standard Deviation (Sample) | $15,498 | $8,708 |
| Standard Deviation (Population) | $15,425 | $8,686 |
Similar Demographics by Median Male Earnings
Demographics Similar to Bhutanese by Median Male Earnings
In terms of median male earnings, the demographic groups most similar to Bhutanese are Estonian ($61,710, a difference of 0.080%), Immigrants from Norway ($61,628, a difference of 0.21%), Immigrants from Europe ($62,057, a difference of 0.48%), South African ($61,460, a difference of 0.49%), and Immigrants from Latvia ($61,422, a difference of 0.55%).
| Demographics | Rating | Rank | Median Male Earnings |
| Immigrants | Belarus | 100.0 /100 | #43 | Exceptional $62,658 |
| Cambodians | 100.0 /100 | #44 | Exceptional $62,516 |
| Bulgarians | 100.0 /100 | #45 | Exceptional $62,378 |
| Immigrants | Czechoslovakia | 99.9 /100 | #46 | Exceptional $62,217 |
| Immigrants | Austria | 99.9 /100 | #47 | Exceptional $62,164 |
| Immigrants | Malaysia | 99.9 /100 | #48 | Exceptional $62,121 |
| Immigrants | Europe | 99.9 /100 | #49 | Exceptional $62,057 |
| Bhutanese | 99.9 /100 | #50 | Exceptional $61,759 |
| Estonians | 99.9 /100 | #51 | Exceptional $61,710 |
| Immigrants | Norway | 99.9 /100 | #52 | Exceptional $61,628 |
| South Africans | 99.9 /100 | #53 | Exceptional $61,460 |
| Immigrants | Latvia | 99.9 /100 | #54 | Exceptional $61,422 |
| Greeks | 99.9 /100 | #55 | Exceptional $61,242 |
| Lithuanians | 99.9 /100 | #56 | Exceptional $61,228 |
| Immigrants | Scotland | 99.9 /100 | #57 | Exceptional $61,220 |
Demographics Similar to Hispanics or Latinos by Median Male Earnings
In terms of median male earnings, the demographic groups most similar to Hispanics or Latinos are Apache ($46,429, a difference of 0.020%), Honduran ($46,374, a difference of 0.10%), Chippewa ($46,368, a difference of 0.11%), Cuban ($46,580, a difference of 0.35%), and Creek ($46,594, a difference of 0.38%).
| Demographics | Rating | Rank | Median Male Earnings |
| Guatemalans | 0.0 /100 | #305 | Tragic $46,736 |
| Dutch West Indians | 0.0 /100 | #306 | Tragic $46,656 |
| Immigrants | Dominican Republic | 0.0 /100 | #307 | Tragic $46,655 |
| Ottawa | 0.0 /100 | #308 | Tragic $46,611 |
| Creek | 0.0 /100 | #309 | Tragic $46,594 |
| Cubans | 0.0 /100 | #310 | Tragic $46,580 |
| Apache | 0.0 /100 | #311 | Tragic $46,429 |
| Hispanics or Latinos | 0.0 /100 | #312 | Tragic $46,419 |
| Hondurans | 0.0 /100 | #313 | Tragic $46,374 |
| Chippewa | 0.0 /100 | #314 | Tragic $46,368 |
| Immigrants | Guatemala | 0.0 /100 | #315 | Tragic $46,244 |
| Immigrants | Caribbean | 0.0 /100 | #316 | Tragic $46,193 |
| Mexicans | 0.0 /100 | #317 | Tragic $46,147 |
| Cheyenne | 0.0 /100 | #318 | Tragic $46,062 |
| Haitians | 0.0 /100 | #319 | Tragic $45,903 |