Bhutanese vs Immigrants from China Ambulatory Disability
COMPARE
Bhutanese
Immigrants from China
Ambulatory Disability
Ambulatory Disability Comparison
Bhutanese
Immigrants from China
5.8%
AMBULATORY DISABILITY
98.8/ 100
METRIC RATING
89th/ 347
METRIC RANK
5.3%
AMBULATORY DISABILITY
100.0/ 100
METRIC RATING
15th/ 347
METRIC RANK
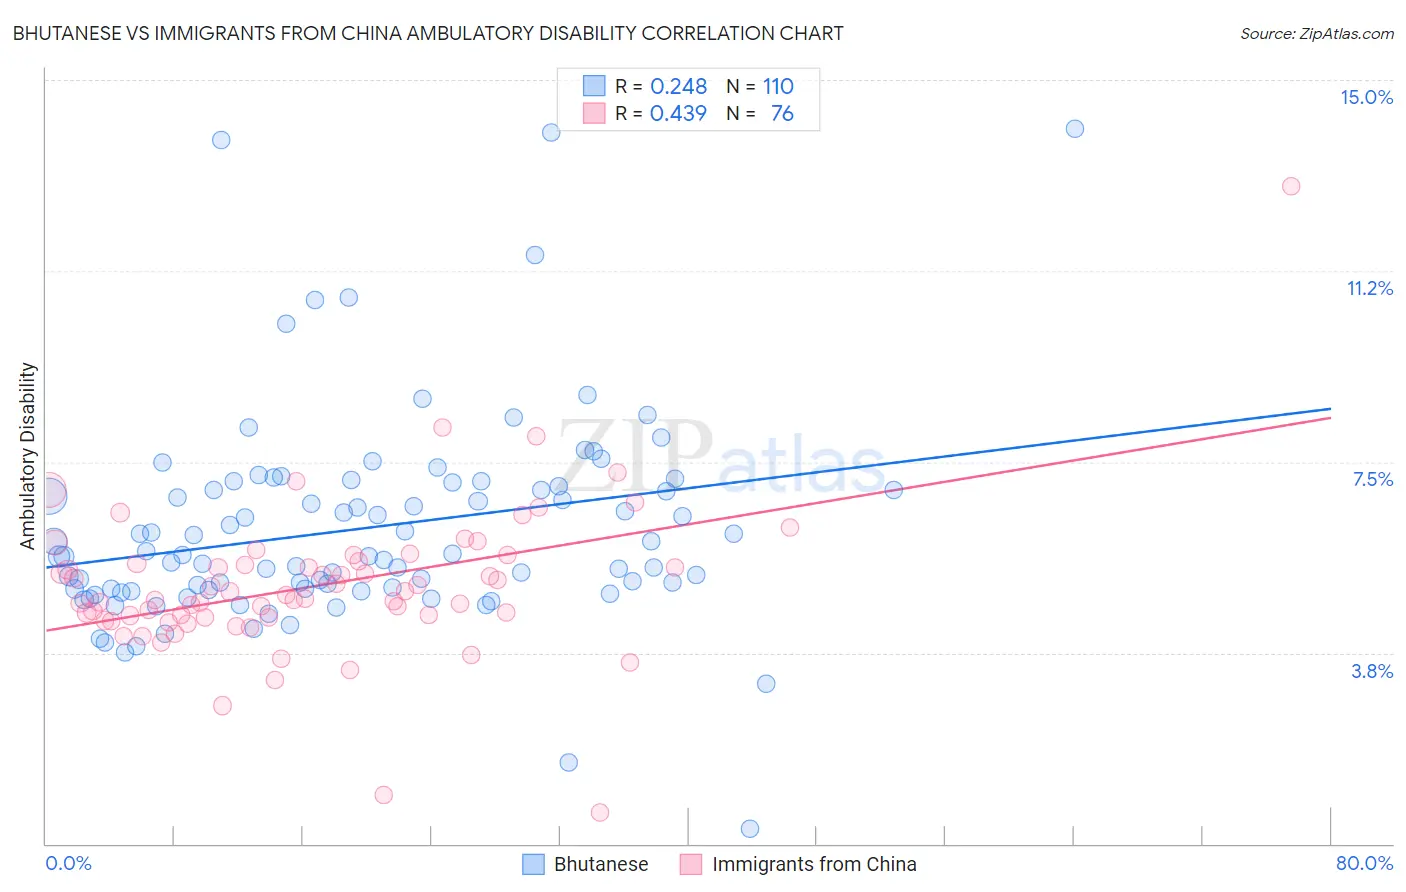
Bhutanese vs Immigrants from China Ambulatory Disability Correlation Chart
The statistical analysis conducted on geographies consisting of 455,305,094 people shows a weak positive correlation between the proportion of Bhutanese and percentage of population with ambulatory disability in the United States with a correlation coefficient (R) of 0.248 and weighted average of 5.8%. Similarly, the statistical analysis conducted on geographies consisting of 456,848,702 people shows a moderate positive correlation between the proportion of Immigrants from China and percentage of population with ambulatory disability in the United States with a correlation coefficient (R) of 0.439 and weighted average of 5.3%, a difference of 8.5%.
Ambulatory Disability Correlation Summary
| Measurement | Bhutanese | Immigrants from China |
| Minimum | 0.28% | 0.61% |
| Maximum | 14.0% | 12.9% |
| Range | 13.8% | 12.3% |
| Mean | 6.2% | 5.1% |
| Median | 5.7% | 4.8% |
| Interquartile 25% (IQ1) | 5.0% | 4.4% |
| Interquartile 75% (IQ3) | 7.0% | 5.5% |
| Interquartile Range (IQR) | 2.0% | 1.1% |
| Standard Deviation (Sample) | 2.1% | 1.5% |
| Standard Deviation (Population) | 2.1% | 1.5% |
Similar Demographics by Ambulatory Disability
Demographics Similar to Bhutanese by Ambulatory Disability
In terms of ambulatory disability, the demographic groups most similar to Bhutanese are Australian (5.8%, a difference of 0.0%), Immigrants from Sudan (5.8%, a difference of 0.0%), Soviet Union (5.8%, a difference of 0.12%), Immigrants from Chile (5.8%, a difference of 0.16%), and Immigrants from Sierra Leone (5.8%, a difference of 0.17%).
| Demographics | Rating | Rank | Ambulatory Disability |
| Palestinians | 99.2 /100 | #82 | Exceptional 5.7% |
| Eastern Europeans | 99.2 /100 | #83 | Exceptional 5.7% |
| Ugandans | 99.2 /100 | #84 | Exceptional 5.7% |
| South Americans | 99.0 /100 | #85 | Exceptional 5.7% |
| Latvians | 99.0 /100 | #86 | Exceptional 5.7% |
| Immigrants | Chile | 98.9 /100 | #87 | Exceptional 5.8% |
| Soviet Union | 98.9 /100 | #88 | Exceptional 5.8% |
| Bhutanese | 98.8 /100 | #89 | Exceptional 5.8% |
| Australians | 98.8 /100 | #90 | Exceptional 5.8% |
| Immigrants | Sudan | 98.8 /100 | #91 | Exceptional 5.8% |
| Immigrants | Sierra Leone | 98.6 /100 | #92 | Exceptional 5.8% |
| Immigrants | Denmark | 98.6 /100 | #93 | Exceptional 5.8% |
| Kenyans | 98.4 /100 | #94 | Exceptional 5.8% |
| Immigrants | El Salvador | 98.4 /100 | #95 | Exceptional 5.8% |
| Salvadorans | 98.4 /100 | #96 | Exceptional 5.8% |
Demographics Similar to Immigrants from China by Ambulatory Disability
In terms of ambulatory disability, the demographic groups most similar to Immigrants from China are Immigrants from Eastern Asia (5.3%, a difference of 0.33%), Burmese (5.3%, a difference of 0.48%), Immigrants from Hong Kong (5.3%, a difference of 0.54%), Immigrants from Ethiopia (5.4%, a difference of 0.88%), and Immigrants from Sri Lanka (5.4%, a difference of 0.88%).
| Demographics | Rating | Rank | Ambulatory Disability |
| Immigrants | South Central Asia | 100.0 /100 | #8 | Exceptional 5.1% |
| Iranians | 100.0 /100 | #9 | Exceptional 5.1% |
| Yup'ik | 100.0 /100 | #10 | Exceptional 5.2% |
| Immigrants | Korea | 100.0 /100 | #11 | Exceptional 5.2% |
| Okinawans | 100.0 /100 | #12 | Exceptional 5.3% |
| Burmese | 100.0 /100 | #13 | Exceptional 5.3% |
| Immigrants | Eastern Asia | 100.0 /100 | #14 | Exceptional 5.3% |
| Immigrants | China | 100.0 /100 | #15 | Exceptional 5.3% |
| Immigrants | Hong Kong | 100.0 /100 | #16 | Exceptional 5.3% |
| Immigrants | Ethiopia | 100.0 /100 | #17 | Exceptional 5.4% |
| Immigrants | Sri Lanka | 100.0 /100 | #18 | Exceptional 5.4% |
| Indians (Asian) | 100.0 /100 | #19 | Exceptional 5.4% |
| Ethiopians | 100.0 /100 | #20 | Exceptional 5.4% |
| Immigrants | Kuwait | 100.0 /100 | #21 | Exceptional 5.4% |
| Immigrants | Israel | 100.0 /100 | #22 | Exceptional 5.4% |