Bhutanese vs South American Median Male Earnings
COMPARE
Bhutanese
South American
Median Male Earnings
Median Male Earnings Comparison
Bhutanese
South Americans
$61,759
MEDIAN MALE EARNINGS
99.9/ 100
METRIC RATING
50th/ 347
METRIC RANK
$54,492
MEDIAN MALE EARNINGS
50.0/ 100
METRIC RATING
174th/ 347
METRIC RANK
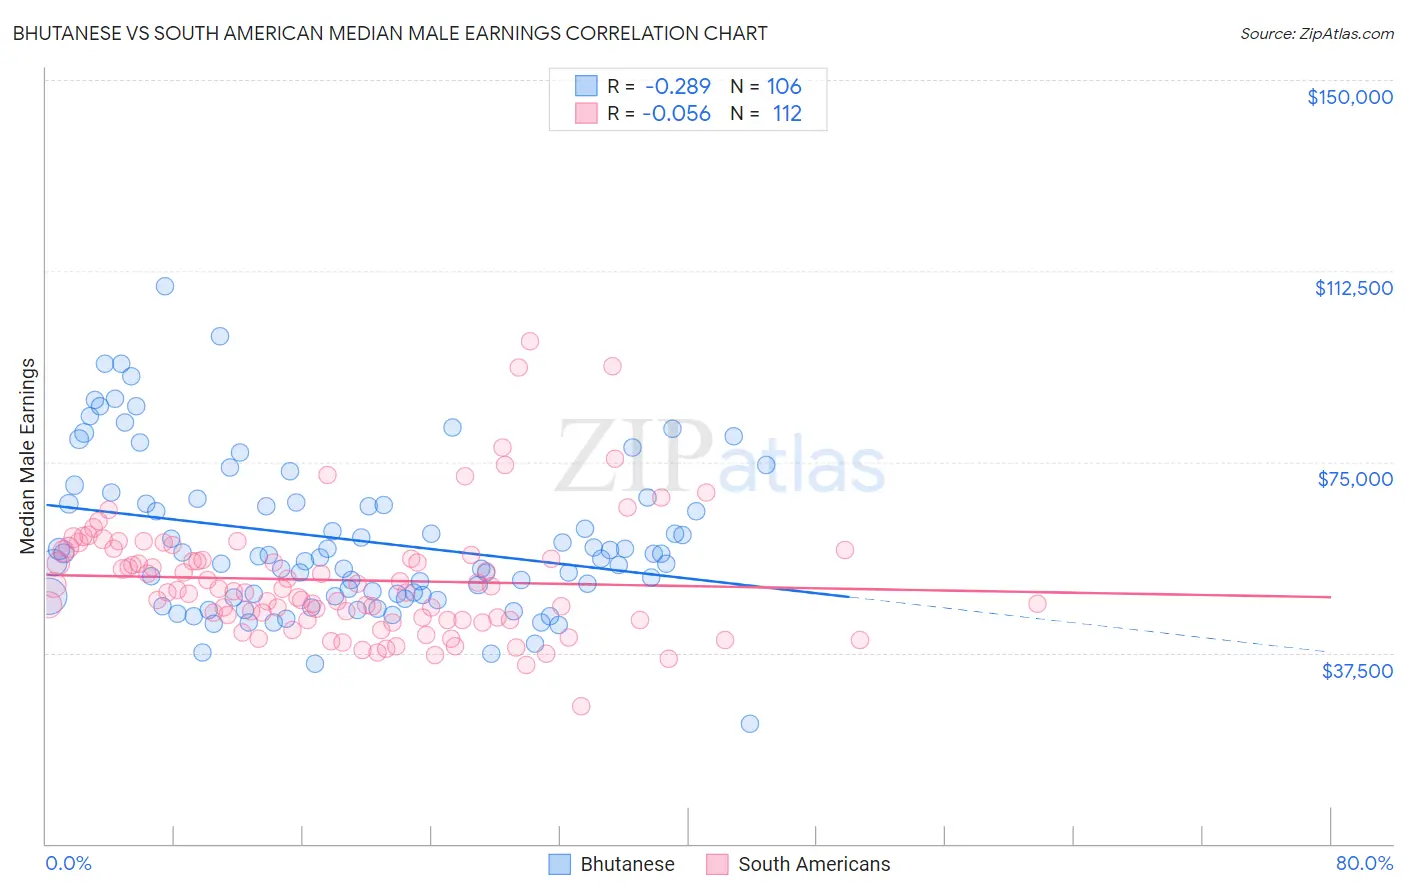
Bhutanese vs South American Median Male Earnings Correlation Chart
The statistical analysis conducted on geographies consisting of 455,387,679 people shows a weak negative correlation between the proportion of Bhutanese and median male earnings in the United States with a correlation coefficient (R) of -0.289 and weighted average of $61,759. Similarly, the statistical analysis conducted on geographies consisting of 493,870,370 people shows a slight negative correlation between the proportion of South Americans and median male earnings in the United States with a correlation coefficient (R) of -0.056 and weighted average of $54,492, a difference of 13.3%.
Median Male Earnings Correlation Summary
| Measurement | Bhutanese | South American |
| Minimum | $23,594 | $27,125 |
| Maximum | $109,392 | $98,656 |
| Range | $85,798 | $71,531 |
| Mean | $59,697 | $51,788 |
| Median | $56,402 | $49,715 |
| Interquartile 25% (IQ1) | $48,730 | $44,028 |
| Interquartile 75% (IQ3) | $67,058 | $57,077 |
| Interquartile Range (IQR) | $18,327 | $13,050 |
| Standard Deviation (Sample) | $15,498 | $11,850 |
| Standard Deviation (Population) | $15,425 | $11,797 |
Similar Demographics by Median Male Earnings
Demographics Similar to Bhutanese by Median Male Earnings
In terms of median male earnings, the demographic groups most similar to Bhutanese are Estonian ($61,710, a difference of 0.080%), Immigrants from Norway ($61,628, a difference of 0.21%), Immigrants from Europe ($62,057, a difference of 0.48%), South African ($61,460, a difference of 0.49%), and Immigrants from Latvia ($61,422, a difference of 0.55%).
| Demographics | Rating | Rank | Median Male Earnings |
| Immigrants | Belarus | 100.0 /100 | #43 | Exceptional $62,658 |
| Cambodians | 100.0 /100 | #44 | Exceptional $62,516 |
| Bulgarians | 100.0 /100 | #45 | Exceptional $62,378 |
| Immigrants | Czechoslovakia | 99.9 /100 | #46 | Exceptional $62,217 |
| Immigrants | Austria | 99.9 /100 | #47 | Exceptional $62,164 |
| Immigrants | Malaysia | 99.9 /100 | #48 | Exceptional $62,121 |
| Immigrants | Europe | 99.9 /100 | #49 | Exceptional $62,057 |
| Bhutanese | 99.9 /100 | #50 | Exceptional $61,759 |
| Estonians | 99.9 /100 | #51 | Exceptional $61,710 |
| Immigrants | Norway | 99.9 /100 | #52 | Exceptional $61,628 |
| South Africans | 99.9 /100 | #53 | Exceptional $61,460 |
| Immigrants | Latvia | 99.9 /100 | #54 | Exceptional $61,422 |
| Greeks | 99.9 /100 | #55 | Exceptional $61,242 |
| Lithuanians | 99.9 /100 | #56 | Exceptional $61,228 |
| Immigrants | Scotland | 99.9 /100 | #57 | Exceptional $61,220 |
Demographics Similar to South Americans by Median Male Earnings
In terms of median male earnings, the demographic groups most similar to South Americans are South American Indian ($54,508, a difference of 0.030%), Dutch ($54,410, a difference of 0.15%), Spaniard ($54,401, a difference of 0.17%), Welsh ($54,647, a difference of 0.28%), and Immigrants from Peru ($54,695, a difference of 0.37%).
| Demographics | Rating | Rank | Median Male Earnings |
| Immigrants | Fiji | 61.2 /100 | #167 | Good $54,958 |
| Immigrants | Vietnam | 60.2 /100 | #168 | Good $54,913 |
| French Canadians | 55.6 /100 | #169 | Average $54,722 |
| Finns | 55.6 /100 | #170 | Average $54,721 |
| Immigrants | Peru | 54.9 /100 | #171 | Average $54,695 |
| Welsh | 53.8 /100 | #172 | Average $54,647 |
| South American Indians | 50.4 /100 | #173 | Average $54,508 |
| South Americans | 50.0 /100 | #174 | Average $54,492 |
| Dutch | 48.0 /100 | #175 | Average $54,410 |
| Spaniards | 47.8 /100 | #176 | Average $54,401 |
| Costa Ricans | 44.8 /100 | #177 | Average $54,279 |
| Sierra Leoneans | 44.8 /100 | #178 | Average $54,279 |
| Celtics | 43.9 /100 | #179 | Average $54,242 |
| Iraqis | 42.5 /100 | #180 | Average $54,182 |
| Immigrants | Immigrants | 42.1 /100 | #181 | Average $54,168 |