Yaqui vs Bolivian Median Family Income
COMPARE
Yaqui
Bolivian
Median Family Income
Median Family Income Comparison
Yaqui
Bolivians
$87,289
MEDIAN FAMILY INCOME
0.0/ 100
METRIC RATING
295th/ 347
METRIC RANK
$119,479
MEDIAN FAMILY INCOME
100.0/ 100
METRIC RATING
34th/ 347
METRIC RANK
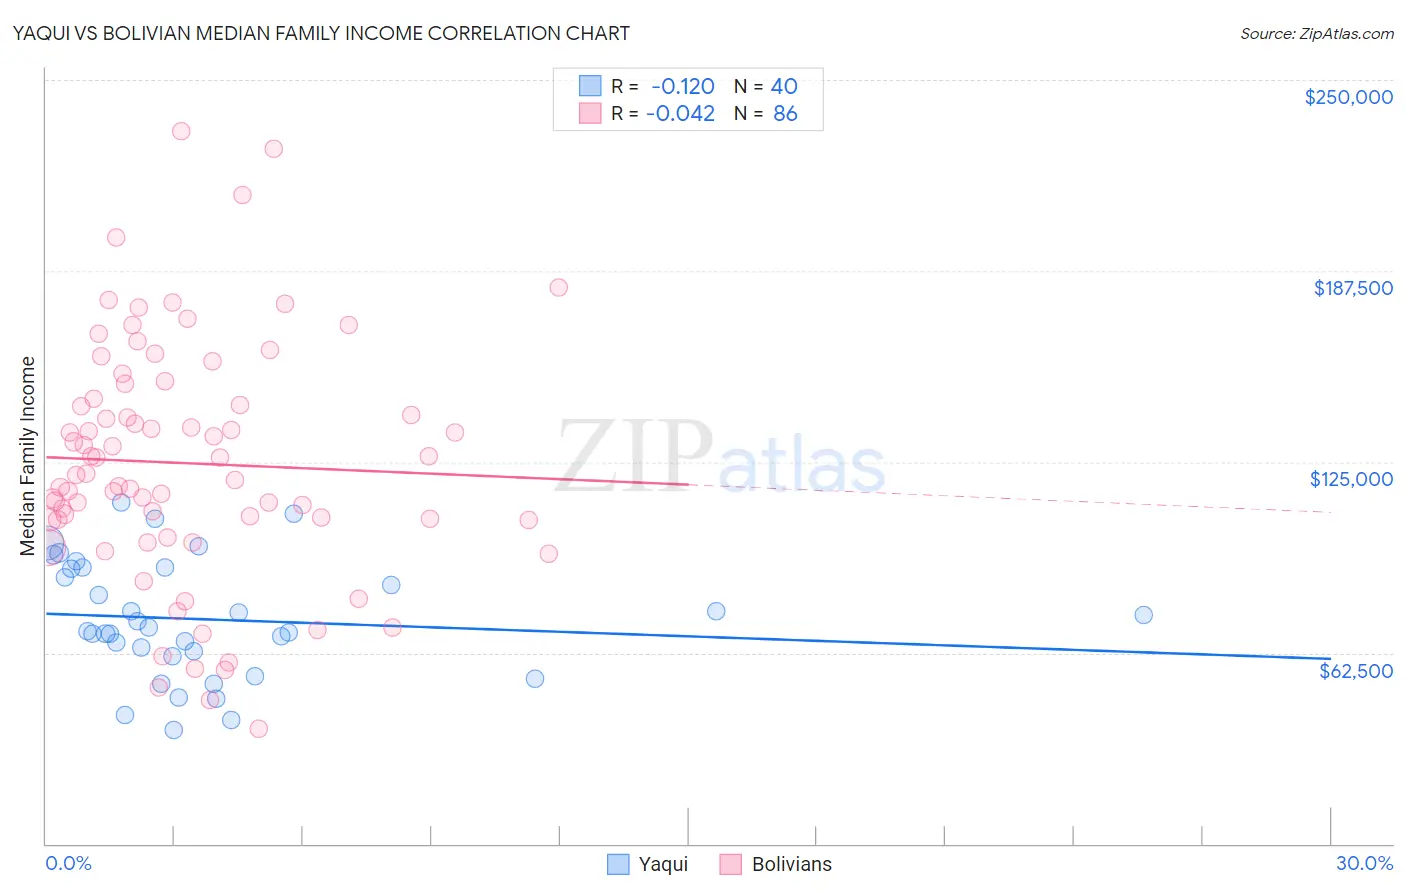
Yaqui vs Bolivian Median Family Income Correlation Chart
The statistical analysis conducted on geographies consisting of 107,704,504 people shows a poor negative correlation between the proportion of Yaqui and median family income in the United States with a correlation coefficient (R) of -0.120 and weighted average of $87,289. Similarly, the statistical analysis conducted on geographies consisting of 184,605,478 people shows no correlation between the proportion of Bolivians and median family income in the United States with a correlation coefficient (R) of -0.042 and weighted average of $119,479, a difference of 36.9%.
Median Family Income Correlation Summary
| Measurement | Yaqui | Bolivian |
| Minimum | $37,174 | $37,679 |
| Maximum | $111,841 | $233,276 |
| Range | $74,667 | $195,597 |
| Mean | $73,462 | $124,569 |
| Median | $70,310 | $120,978 |
| Interquartile 25% (IQ1) | $62,336 | $106,050 |
| Interquartile 75% (IQ3) | $90,136 | $145,603 |
| Interquartile Range (IQR) | $27,800 | $39,553 |
| Standard Deviation (Sample) | $19,183 | $39,306 |
| Standard Deviation (Population) | $18,942 | $39,077 |
Similar Demographics by Median Family Income
Demographics Similar to Yaqui by Median Family Income
In terms of median family income, the demographic groups most similar to Yaqui are Fijian ($87,387, a difference of 0.11%), Immigrants from Guatemala ($87,191, a difference of 0.11%), Cajun ($87,157, a difference of 0.15%), Immigrants from Latin America ($86,989, a difference of 0.34%), and Ute ($87,596, a difference of 0.35%).
| Demographics | Rating | Rank | Median Family Income |
| Cherokee | 0.1 /100 | #288 | Tragic $88,209 |
| Central American Indians | 0.1 /100 | #289 | Tragic $88,034 |
| Shoshone | 0.1 /100 | #290 | Tragic $87,872 |
| Immigrants | Cabo Verde | 0.1 /100 | #291 | Tragic $87,830 |
| Africans | 0.1 /100 | #292 | Tragic $87,820 |
| Ute | 0.0 /100 | #293 | Tragic $87,596 |
| Fijians | 0.0 /100 | #294 | Tragic $87,387 |
| Yaqui | 0.0 /100 | #295 | Tragic $87,289 |
| Immigrants | Guatemala | 0.0 /100 | #296 | Tragic $87,191 |
| Cajuns | 0.0 /100 | #297 | Tragic $87,157 |
| Immigrants | Latin America | 0.0 /100 | #298 | Tragic $86,989 |
| Chippewa | 0.0 /100 | #299 | Tragic $86,852 |
| Ottawa | 0.0 /100 | #300 | Tragic $86,380 |
| Colville | 0.0 /100 | #301 | Tragic $85,792 |
| Spanish American Indians | 0.0 /100 | #302 | Tragic $85,728 |
Demographics Similar to Bolivians by Median Family Income
In terms of median family income, the demographic groups most similar to Bolivians are Soviet Union ($119,262, a difference of 0.18%), Bhutanese ($119,800, a difference of 0.27%), Asian ($119,955, a difference of 0.40%), Immigrants from France ($120,076, a difference of 0.50%), and Immigrants from Sri Lanka ($120,263, a difference of 0.66%).
| Demographics | Rating | Rank | Median Family Income |
| Russians | 100.0 /100 | #27 | Exceptional $120,487 |
| Immigrants | Denmark | 100.0 /100 | #28 | Exceptional $120,445 |
| Latvians | 100.0 /100 | #29 | Exceptional $120,301 |
| Immigrants | Sri Lanka | 100.0 /100 | #30 | Exceptional $120,263 |
| Immigrants | France | 100.0 /100 | #31 | Exceptional $120,076 |
| Asians | 100.0 /100 | #32 | Exceptional $119,955 |
| Bhutanese | 100.0 /100 | #33 | Exceptional $119,800 |
| Bolivians | 100.0 /100 | #34 | Exceptional $119,479 |
| Soviet Union | 100.0 /100 | #35 | Exceptional $119,262 |
| Israelis | 100.0 /100 | #36 | Exceptional $118,577 |
| Australians | 100.0 /100 | #37 | Exceptional $118,440 |
| Immigrants | Turkey | 100.0 /100 | #38 | Exceptional $118,325 |
| Immigrants | Asia | 100.0 /100 | #39 | Exceptional $118,291 |
| Immigrants | Lithuania | 100.0 /100 | #40 | Exceptional $118,053 |
| Estonians | 100.0 /100 | #41 | Exceptional $118,013 |