Bhutanese vs Bolivian 7th Grade
COMPARE
Bhutanese
Bolivian
7th Grade
7th Grade Comparison
Bhutanese
Bolivians
96.6%
7TH GRADE
97.7/ 100
METRIC RATING
109th/ 347
METRIC RANK
95.4%
7TH GRADE
1.1/ 100
METRIC RATING
249th/ 347
METRIC RANK
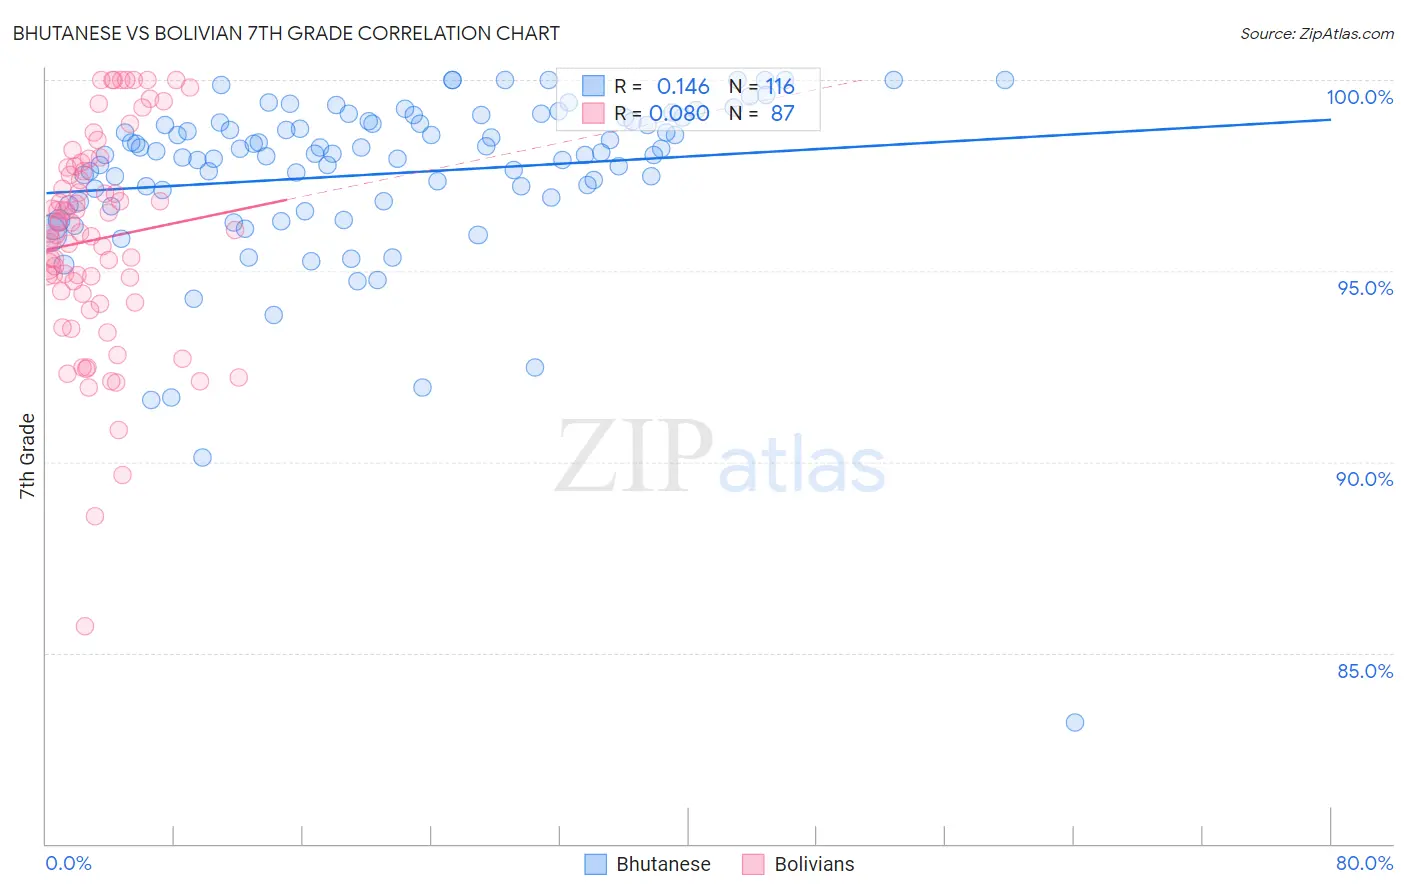
Bhutanese vs Bolivian 7th Grade Correlation Chart
The statistical analysis conducted on geographies consisting of 455,591,134 people shows a poor positive correlation between the proportion of Bhutanese and percentage of population with at least 7th grade education in the United States with a correlation coefficient (R) of 0.146 and weighted average of 96.6%. Similarly, the statistical analysis conducted on geographies consisting of 184,666,822 people shows a slight positive correlation between the proportion of Bolivians and percentage of population with at least 7th grade education in the United States with a correlation coefficient (R) of 0.080 and weighted average of 95.4%, a difference of 1.3%.
7th Grade Correlation Summary
| Measurement | Bhutanese | Bolivian |
| Minimum | 83.2% | 85.7% |
| Maximum | 100.0% | 100.0% |
| Range | 16.8% | 14.3% |
| Mean | 97.5% | 95.8% |
| Median | 98.1% | 96.0% |
| Interquartile 25% (IQ1) | 96.8% | 94.4% |
| Interquartile 75% (IQ3) | 98.9% | 97.7% |
| Interquartile Range (IQR) | 2.1% | 3.3% |
| Standard Deviation (Sample) | 2.3% | 2.8% |
| Standard Deviation (Population) | 2.3% | 2.8% |
Similar Demographics by 7th Grade
Demographics Similar to Bhutanese by 7th Grade
In terms of 7th grade, the demographic groups most similar to Bhutanese are Lumbee (96.6%, a difference of 0.010%), Immigrants from Saudi Arabia (96.6%, a difference of 0.010%), Iroquois (96.6%, a difference of 0.020%), Okinawan (96.6%, a difference of 0.020%), and Immigrants from Latvia (96.6%, a difference of 0.020%).
| Demographics | Rating | Rank | 7th Grade |
| Immigrants | Czechoslovakia | 98.3 /100 | #102 | Exceptional 96.6% |
| Immigrants | Singapore | 98.3 /100 | #103 | Exceptional 96.6% |
| Shoshone | 98.1 /100 | #104 | Exceptional 96.6% |
| South Africans | 98.0 /100 | #105 | Exceptional 96.6% |
| Iroquois | 97.9 /100 | #106 | Exceptional 96.6% |
| Lumbee | 97.8 /100 | #107 | Exceptional 96.6% |
| Immigrants | Saudi Arabia | 97.8 /100 | #108 | Exceptional 96.6% |
| Bhutanese | 97.7 /100 | #109 | Exceptional 96.6% |
| Okinawans | 97.4 /100 | #110 | Exceptional 96.6% |
| Immigrants | Latvia | 97.4 /100 | #111 | Exceptional 96.6% |
| Immigrants | Nonimmigrants | 97.0 /100 | #112 | Exceptional 96.5% |
| Pueblo | 96.8 /100 | #113 | Exceptional 96.5% |
| Immigrants | Zimbabwe | 96.6 /100 | #114 | Exceptional 96.5% |
| Choctaw | 96.6 /100 | #115 | Exceptional 96.5% |
| Syrians | 96.6 /100 | #116 | Exceptional 96.5% |
Demographics Similar to Bolivians by 7th Grade
In terms of 7th grade, the demographic groups most similar to Bolivians are Paiute (95.4%, a difference of 0.010%), Immigrants from Cameroon (95.4%, a difference of 0.020%), Immigrants from Jamaica (95.4%, a difference of 0.020%), Tongan (95.4%, a difference of 0.030%), and Immigrants from Ethiopia (95.3%, a difference of 0.030%).
| Demographics | Rating | Rank | 7th Grade |
| Immigrants | Senegal | 1.9 /100 | #242 | Tragic 95.5% |
| U.S. Virgin Islanders | 1.6 /100 | #243 | Tragic 95.4% |
| Uruguayans | 1.6 /100 | #244 | Tragic 95.4% |
| Immigrants | Middle Africa | 1.5 /100 | #245 | Tragic 95.4% |
| Ethiopians | 1.5 /100 | #246 | Tragic 95.4% |
| Tongans | 1.3 /100 | #247 | Tragic 95.4% |
| Paiute | 1.2 /100 | #248 | Tragic 95.4% |
| Bolivians | 1.1 /100 | #249 | Tragic 95.4% |
| Immigrants | Cameroon | 0.9 /100 | #250 | Tragic 95.4% |
| Immigrants | Jamaica | 0.9 /100 | #251 | Tragic 95.4% |
| Immigrants | Ethiopia | 0.9 /100 | #252 | Tragic 95.3% |
| Somalis | 0.9 /100 | #253 | Tragic 95.3% |
| Colombians | 0.8 /100 | #254 | Tragic 95.3% |
| Koreans | 0.8 /100 | #255 | Tragic 95.3% |
| Immigrants | China | 0.7 /100 | #256 | Tragic 95.3% |